Introduction
Asternic Call Center Stats is a queue reporting solution for the open source Asterisk© PBX. In order to use the software you must have a working Asterisk© PBX, and you should be using queues with it.
Asterisk is a powerful and complex software. You won’t find instructions on setting up Asterisk itself here. If you are new to Asterisk and VoIP and want to get started, an easy and quick way is to install one Asterisk based Linux distribution like Issabel, PBXinaFlash, AsteriskNow, etc. Any of these distributions will install a complete Linux system with Asterisk and a web fronted for configuring it.
Once you have Asterisk working you can install Asternic Call Center Stats to get the best of breed queue reports and metrics available for it. Don’t take our word for it. Install it and see it for yourself.
This guide will help you install Asternic Call Center Stats PRO into your server. If you want to install Asternic Call Center Stats Lite instead, please use this guide instead.
Requirements
Asternic Call Center Stats PRO is a PHP application, encoded with Ioncube. There are certain requirements to be met in order to successfully run the software. If you use FreePBX© distro or Issabel©, server requirements are already met. If you are installing on a new Linux server, be sure the software listed in the server requirements is installed and workig prior installing this software.
Server Requirements
On the server side you need:
- A web server (Apache/Nginx)
- 32 or 64 bits Linux Operating System
- PHP 5.1 or above
- MariaDB/MySQL Server 5 or above
- Asterisk 1.4 or above
Client Requirements
To access reports you will use a web browser. For a full experience you have to use a modern one:
- Modern Web Browser (IE10/Edge, Google Chrome, Safari, Firefox, Opera)
- Javascript enabled
Other Requirements
Installation is performed via the Linux command line. You must be able to access your server command line either using the local console, or perhaps using a terminal software through SSH. You will also need to write some commands there, so being comfotable in the command line is a plus, although not a strict requirement as you can just copy and paste the actual commands from this guide.
Installation
To install the software you need to access your server command line and have root permissions. You must know MySQL/MariaDB root password in order for the installation to succeed as you will be prompted for it.
Log into your server and enter these commands, followed by Return :
cd /usr/src
wget http://download.asternic.net/asternic-stats-pro-2.3.11.tgz
The above comands will download our latest release into /usr/src on your server. You need to extract the package and change the working directory to the extracted location, you can do so with these commands:
tar zxvf asternic-stats-pro-2.3.11.tgz
cd asternic-stats-pro-2.3.11
Now that the software is extracted, you can proceed to install it. Simply run:
sudo make install
The web application will be installed in /var/www/html/stats by default. If you want to install the web files into a different location, you can set the DESTDIR variable on the make command, like:
sudo make install DESTDIR=/var/www/html/reports
Installation will start. When prompted, enter MySQL root password:
Creating MySQL database and tables...
Please enter the MySQL root password:
If you use the FreePBX distro, that password is usually blank, so you can just hit Return when prompted for it.
Then you will be prompted to enter the administrator (admin) password to access the web based reports:
Select a password for the 'admin' user:
You can type whatever password you like and hit Return . You will be asked to confirm the password next. Type the password again and hit Return
Finally the installation script will download other dependencies and requirements. It might be possible that the system will ask for a Yes/No confirmation:
Do you want to continue? [Y/n]
If that happens, please answer Yes as all requirements are needed for a correct installation.
After a few minutes, installation will be completed:
Restarting apache2 (via systemctl): apache2.service.

Done!
Upgrade
In order to upgrade, your license/support must be within the yearly support period. You can check that by logging into your existing Asternic, under Setup/License menu. If yearly support has expired, you must purchase the annual software maintenance before attempting an upgrade.
Upgrading from previous 2.X versions
To upgrade the software you need to access your server command line and have root permissions. Log into your server and follow these steps:
cd /usr/src
wget http://download.asternic.net/asternic-stats-pro-2.3.11.tgz
The above comands will download our latest release into /usr/src on your server. You need now to extracts the package and change the working directory to the extracted location:
tar zxvf asternic-stats-pro-2.3.11.tgz
cd asternic-stats-pro-2.3.11
Now that the software is extracted, you can proceed to upgrade it. Simply run:
sudo make upgrade
That should get you going. When you run the above commands, be sure to inspect the output for possible errors or warnings.
Since release 2.3.0, some table schemas changed quite a bit. You will have to use the asterniclog parser instead of the (old) tailqueuelog script used in 1.X versions. Also, as the schema change is major, all existing data must be reconverted. Data migrations will be handled automatically by the asterniclog service when it restarts. If you have lots of data this process will take several minutes, up to hours depending on data amount and server load. So, if you have millions of records, it is better to attempt the upgrade after hours when the machine load is low and there is no need to get reports while the convertion takes place
Upgrading from 1.X versions
There is no upgrade path from 1.X to 2.X. If you need to peform such upgrade, please contact us and we will guide you on the upgrade.
Configuration
Asternic reports run independently of your Asterisk PBX, however, to work correctly you need to have certain settings and configuration in your Asterisk setup. Then you have some configurations to do on the Asternic side of things, both basic configurations that are needed are listed below.
Asterisk Configuration
Queue Log
Asternic reads and parses queue log activity data that is registered by Asterisk in the queue_log file. In most setups and Asterisk distros, that log file is enabled by default.
However, there are some distros, like MiRTA or SNEP, that might have queue log to file disabled as they use another way to store data in real time using a database.
In those cases, you will have to edit the Asterisk logger configuration to enable it. Look at the file /etc/asterisk/logger.conf and under the [general] section be sure to have both of these lines:
queue_log=yes
queue_log_to_file=yes
Queue Configuration
If you are using Issabel© or FreePBX©, you shoud add the following to your /etc/asterisk/queues_custom_general.conf file:
log_membername_as_agent=yes
This setting will prevent having two different agents for selection in Asternic agent list for the same person: one with the actual name, and another one as Agent/XXXX where XXXX is their extension number.
Another way to cirucumvent this Asterisk bug feature, is to pass the -c command line parameter to the asterniclog service. This setting is enabled by default on a new installation in the file /etc/sysconfig/asterniclog (or /etc/default/asterniclog on Debian based distributions).
Asternic
Realtime
For the realtime page to work, you must supply valid Asterisk Manager Interface (AMI) credentials to Asternic.
Look at your /etc/asterisk/manager.conf file and search for a valid user and secret, it will look something similar to this:
[admin]
secret=amp111
deny=0.0.0.0/0.0.0.0
permit=127.0.0.1/255.255.255.0
read=all
write=all
Take note of the user (betwen brackets) and the secret it has configured. In the above case, the user is admin and the secret is amp111.
Log as admin to Asternic reports and select Setup => AMI Servers. From there you can set the corresponding user and secret for your server:
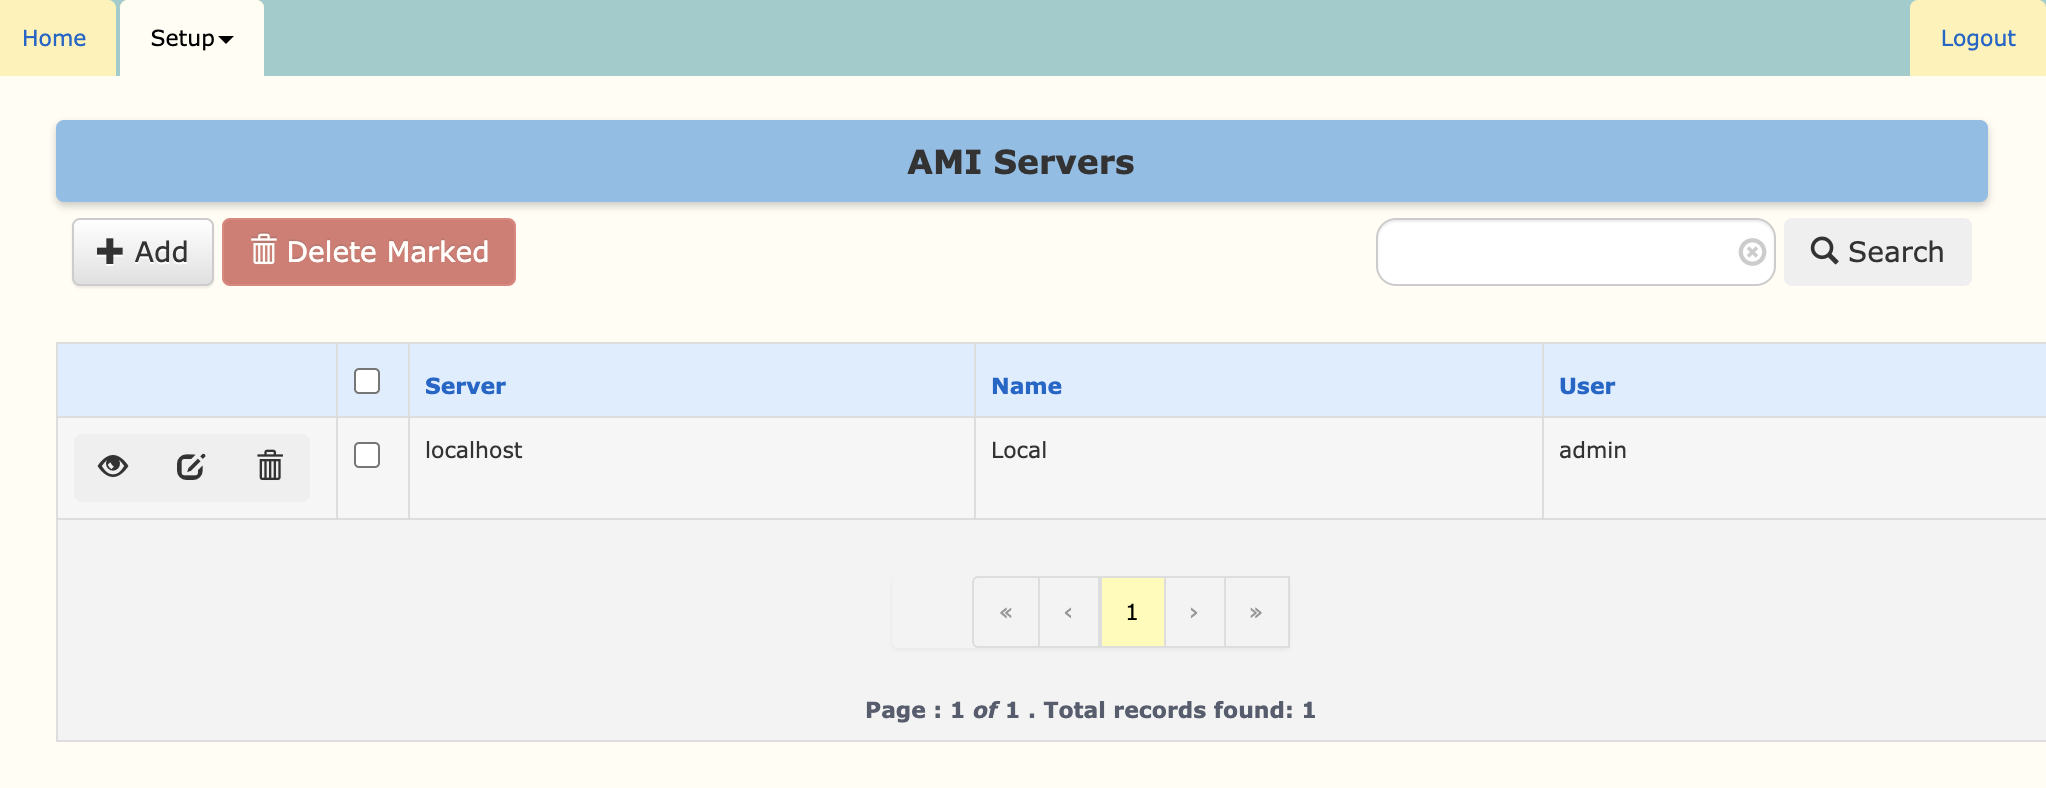
Click on the edit icon (the one between the eye and the trash can) for the localhost entry to modify the credentials:
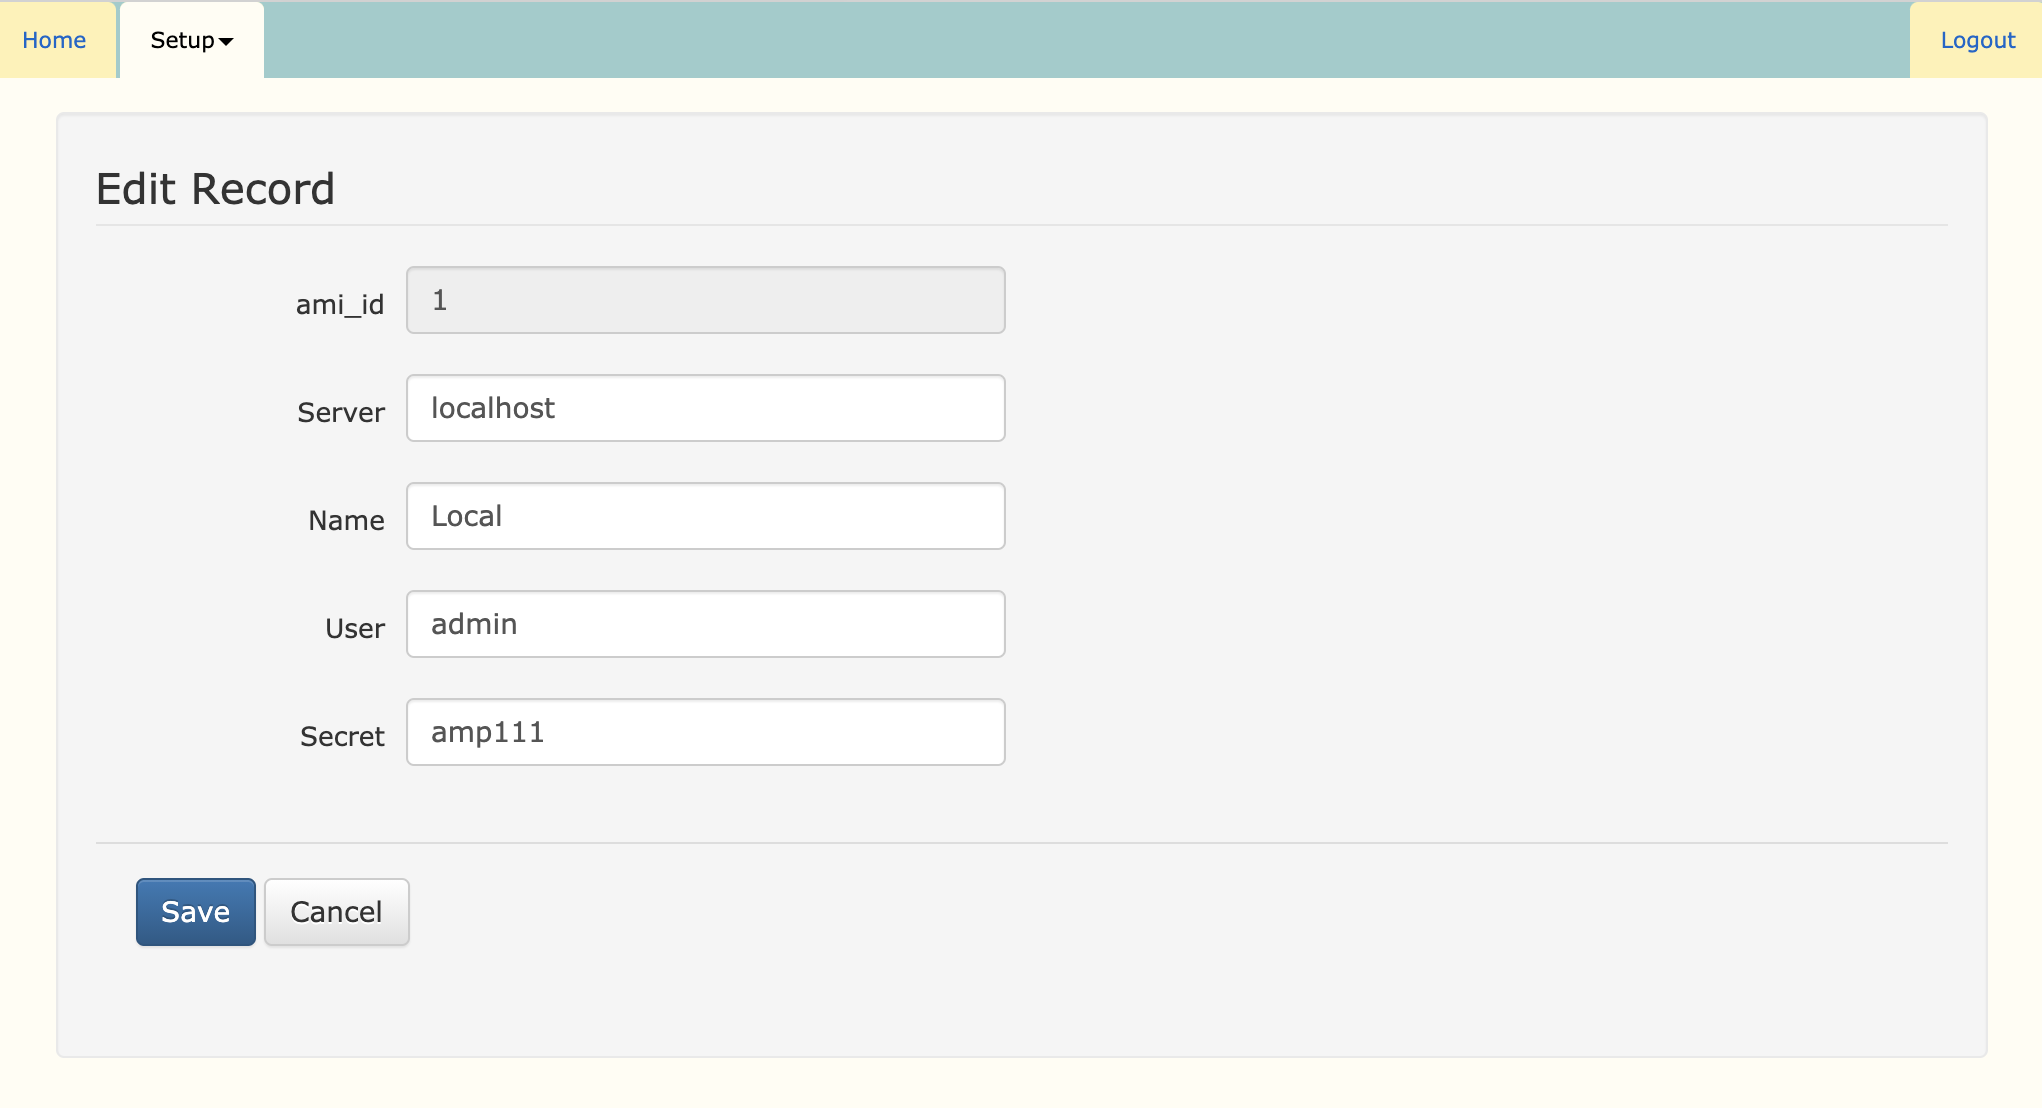
Click Save when your are done.
Activating the License
Activation Code
Asternic Call Center Stats PRO requires an activation code, you can purchase a license to get a perpetual activation code, or you can start a 30 days trial for testing it out before you buy.
Point your browser to:
(replace your.web.server with your actual server IP address or host name)
Your server needs Internet access in order to acquiere a license. If it does not have such access, you will need to grant it for a moment. In case you have web access via Proxy, you can configure the
proxy url in /var/www/html/stats/config.php
$PROXY = "your.proxy.com:3128";
If you do not have a license file yet, you will see the License Activation form where you can enter licensing details:
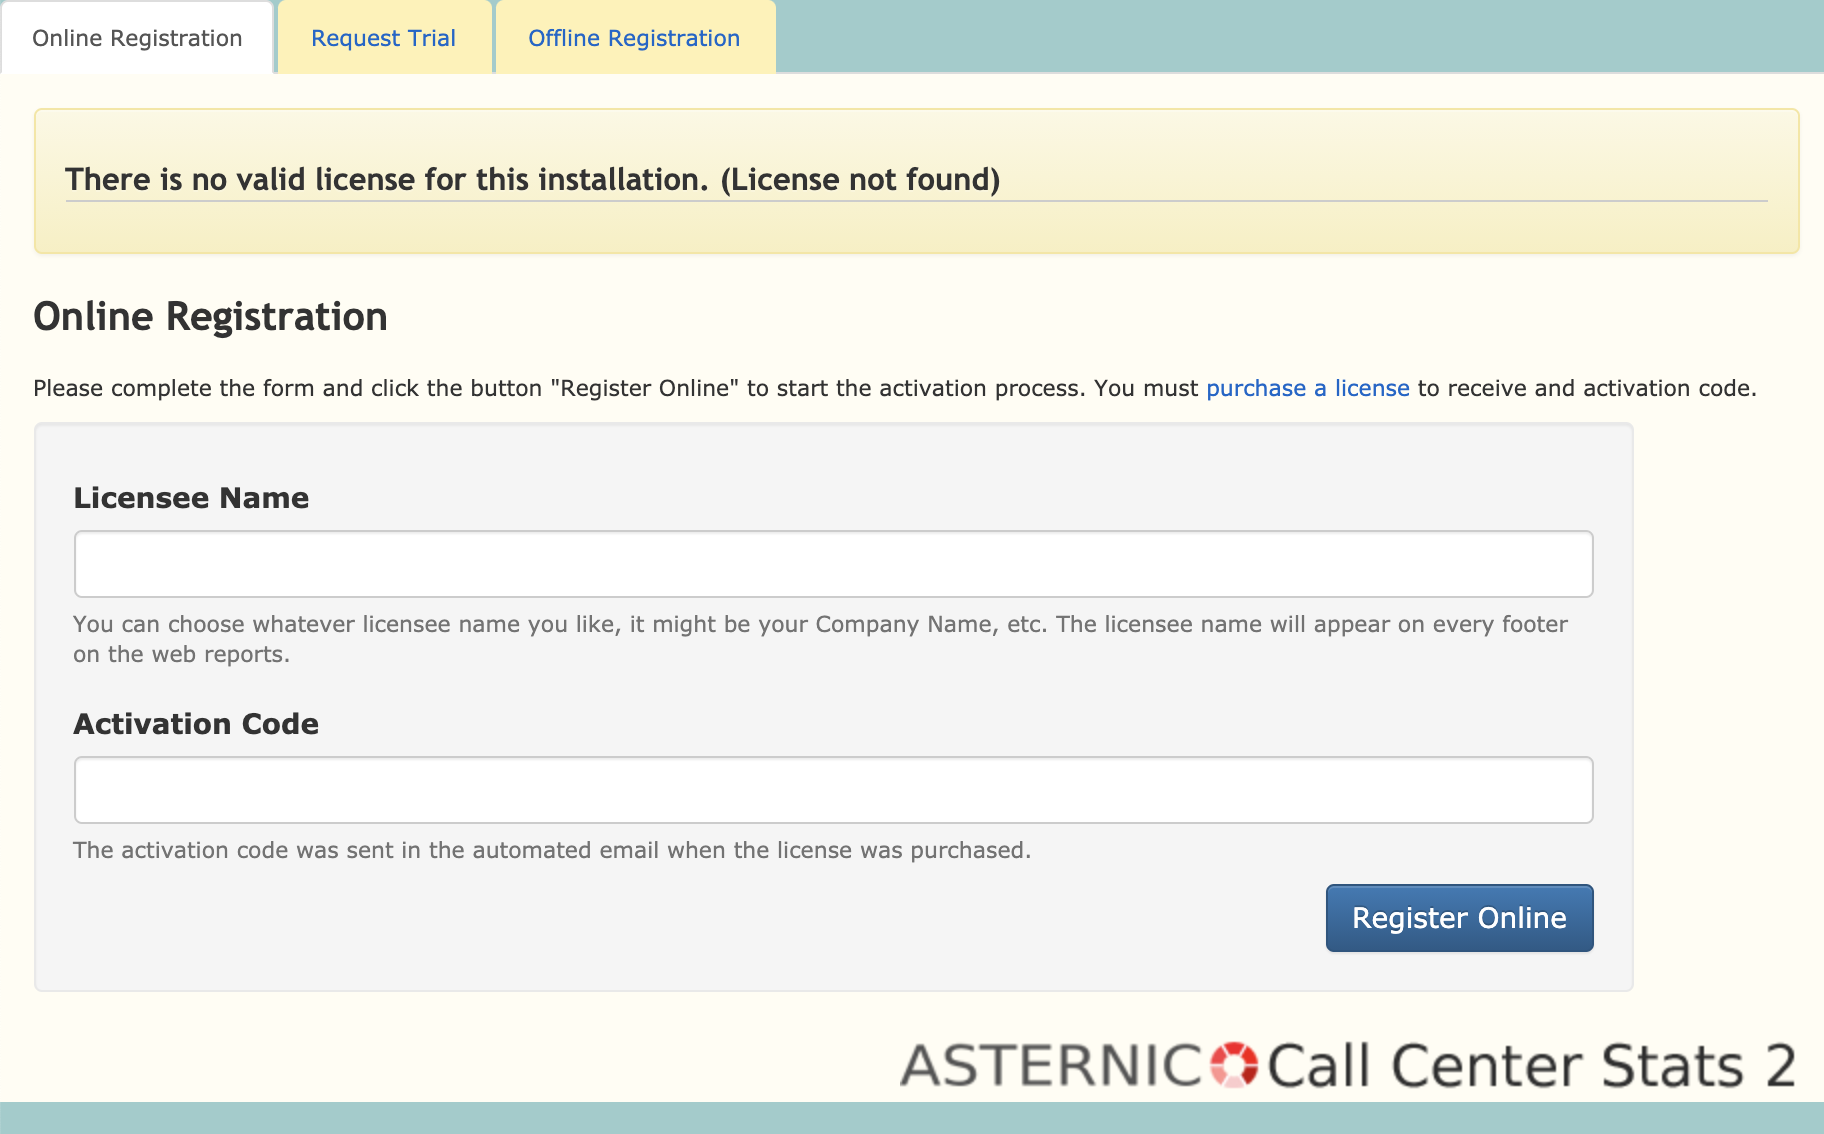
The registration name can be chosen by you and it could be your company name, customer name, etc.
A legend will appear in the reports footer saying “Licensed to ______” where ______ is the registation name you used at time of activation. That name cannot be changed in the future, so please chose wisely.
After entering both the activation code and registration name, click the Register Online button to acquire a license file.
Try before you buy
If you want to test the software before purchase, click the Request Trial tab on the form:
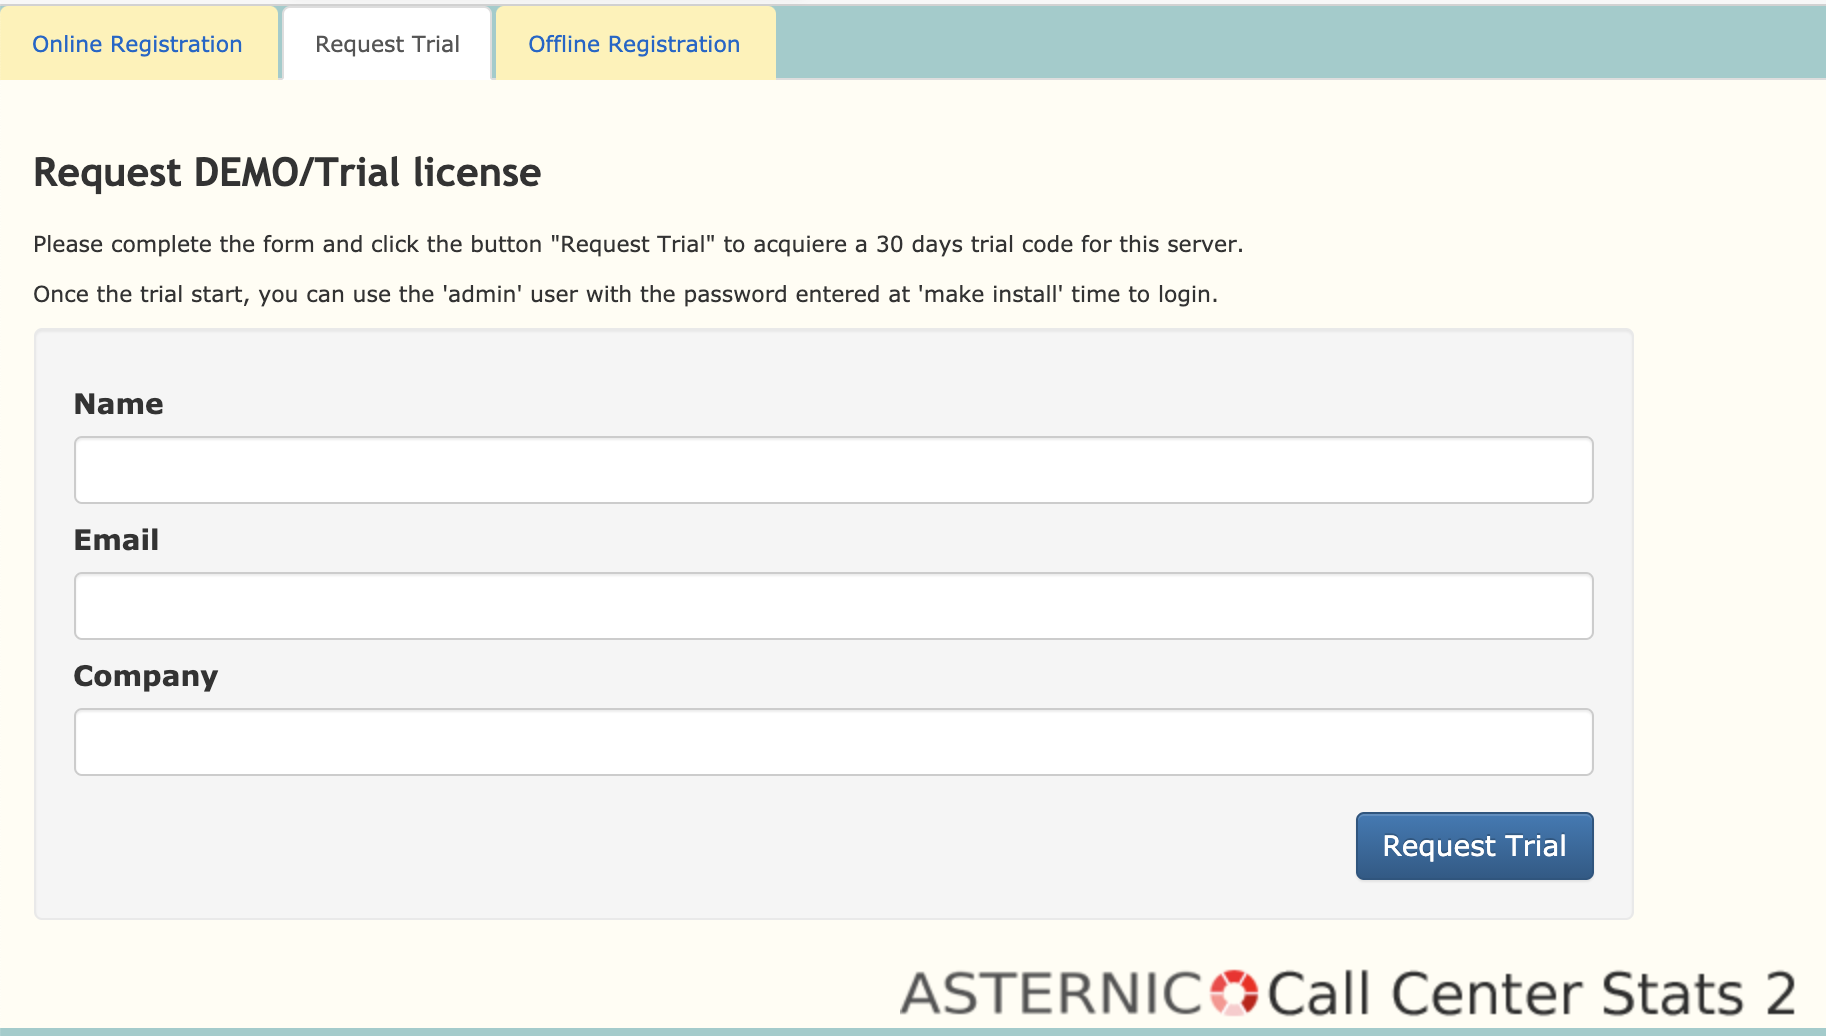
Fill the required fields and click the Request Trial button to get a 30 days trial license file for your server.
First login
After acquiring a license, you will be ready to use the software. You will be presented with the login form.
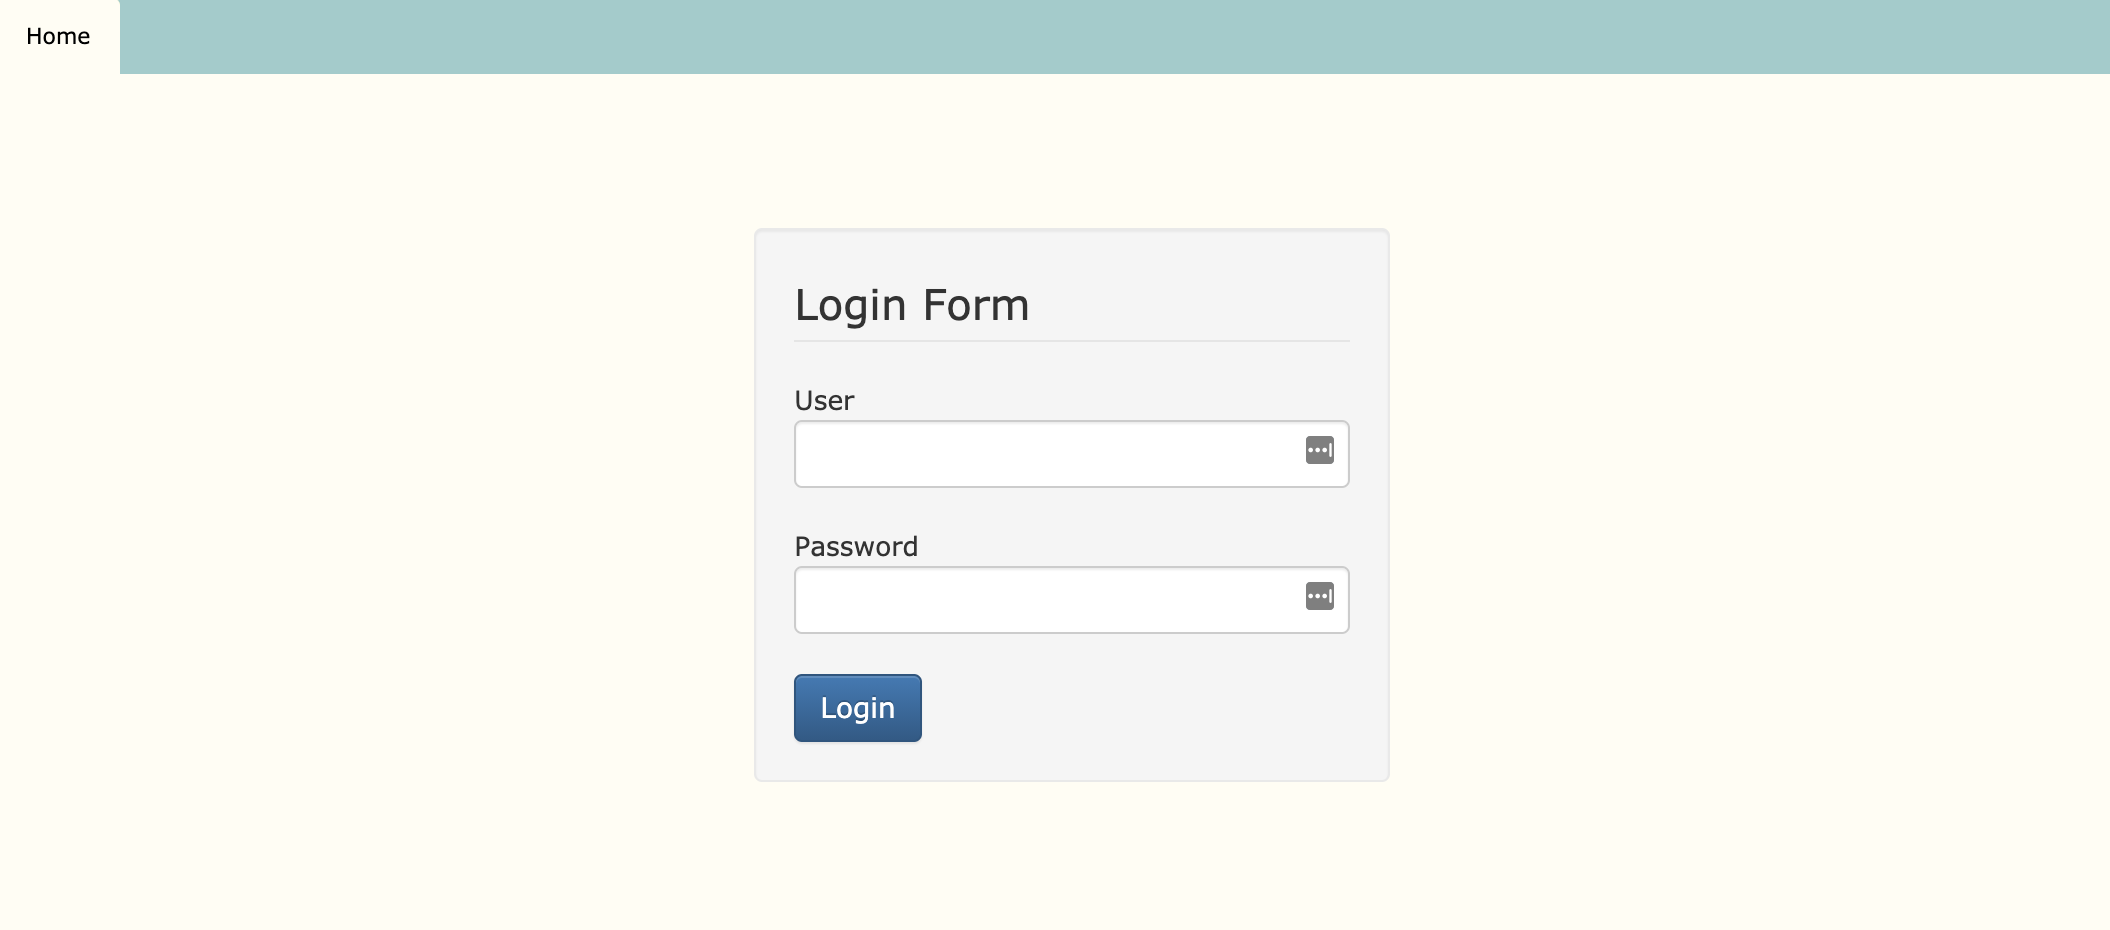
The default administrator user is named admin, and the password to log in is the one you typed/selected during installation.
Asterniclog Service
Asternic is a reporting software, as such it needs to gather queue activity from the Asterisk queue_log file. That is handled by a service daemon named asterniclog that can be managed via normal Linux system tools, that can be used to start, stop or restart the service.
Service configuration
There is an OPTIONS file you should edit to pass command line parameters to the service at startup. In general, the default OPTIONS are ok for most users, however you might want to enable extra features, like convert Local members to their queue member name, enabling a debug log, setting up a custom trigger script, etc. In those cases you must edit that file and add the appropriate parameters there.
The file is named asterniclog and is located in the folder /etc/sysconfig/ on Centos/RedHat based distributions like FreePBX or Issabel, or in the folder /etc/default in Debian/Ubuntu based distributions. The default content for Issabel© or FreePBX© is:
OPTIONS="-u qstatsUser -p qstatsPassw0rd -d qstats -h localhost -l /var/log/asterisk/queue_log -c --daemon"
If you do not use FreePBX©, then the parameters are a little bit shorter:
OPTIONS="-u qstatsUser -p qstatsPassw0rd -d qstats -h localhost -l /var/log/asterisk/queue_log --daemon"
Normally, you do not need to change anything in there, unless you decide to use a different MySQL user or password.
Full options list
There are many options to the script that can be used on a number of situations. In general, there is no need to modify default values, but if the need arises, you can do more, like enabling debug logs, launch trigger scripts to perform custom actions, etc.
asternicloglog [<options>]
       -u <name>     - Connect to mysql as username <name> [root]
       -p <pw>       - Connect to mysql with password <pw>
       -h <host>     - Connect to mysql host <host> [localhost]
       -d <dbname>   - Connect to mysql database <dbname> [qstats]
       -l <queuelog> - Path and name for queue_log [/var/log/asterisk/queue_log]
       -c            - Convert Local/xxx@from-queue/n to agent name in FreePBX
       -r            - Reparse the full log with no date check
       -s            - Skip events with SIP/IAX in queue member
       -g            - Specify a log directory to write debug messages when daemonized
       -nr           - Skip table repair at startup
       --daemon      - Daemonize process and detach from console
       -w            - Write configuration to disk
       -t <script>   - Full path for a trigger shell script for custom hooks/actions
       --purge       - Purge all data from tables and exit
       --repair      - Repair tables and exit
Starting the service
In Centos/RedHat based systems you can do it with the command:
systemctl start asterniclog
In Debian or Ubuntu the correct command is:
/etc/init.d/asterniclog start
After installation, the log parser service will be started automatically. So you do not need to run the above command after installation as it was already executed for you by the installation script.
Stopping the service
In Centos/RedHat based systems you can do it with the command:
systemctl stop asterniclog
In Debian or Ubuntu the correct command is:
/etc/init.d/asterniclog stop
Checking if the service is runnning
In Centos/RedHat based like the FreePBX Distro or Issabel, you can do it with this command:
systemctl status asterniclog
In Debian or Ubuntu you can use this command:
/etc/init.d/asterniclog status
Recordings
Issabel / FreePBX Recordings integration
First and foremost, you must configure your system to record queue calls. That is done inside Issabel/FreePBX configuration. If you configure recordings on an extension level, then recording integration with Asternic won’t work. Be sure to enable recordings at the queue level in your PBX first.
In order to have recordings available in Asternic reports, we provide a custom script that will run as soon as a queue recording is finished. The script will update the Asternic recordings table so they can be retrieved/listened from reports. It can also be configured to do optional convertion to MP3 and optional move/rellocation of the resulting recording to a different location (like a custom storage diretory)
The script is located in /usr/local/parselog/update_mix_mixmonitor.pl
Issabel / FreePBX must be instructed to run the post call recording script. If using Issabel, go to unembedded IssabelPBX and follow the instructions:
You will need to open Settings => Advanced Settings and under the option DEVELOPER AND CUSTOMIZATION you need to set the field POST CALL RECORDING SCRIPT to:
/usr/local/parselog/update_mix_mixmonitor.pl ^{UNIQUEID} ^{MIXMONITOR_FILENAME}
If you do not find the POST CALL RECORDING SCRIPT option, you will have to enable showing and allow modifications of read only settings at the top of the Advanced Settings page inside FreePBX/IssabelPBX, by turning on the following options at the top of the advanced settings page:
Display Readonly Settings
Override Readonly Settings
With those options enabled, you should see the Post Call Recording Script option in the Developer and Customizations section.
Old FreePBX Versions
You will need to apply that patch to FreePBX in order to have the queue recordings integrated in the reports. You can do so with the following commands (change the path to the directory where you extracted the tarball):
For FreePBX version 2.8:
cd /var/www/html/admin/modules/queues
patch < /usr/src/asternic-stats-pro-2.3.11/FreePBX/fpbxmonitor.diff
For FreePBX version 2.9:
cd /var/www/html/admin/modules/queues
patch < /usr/src/asternic-stats-pro-2.3.11/FreePBX/fpbxmonitor29.diff
For FreePBX version 2.10:
cd /var/www/html/admin/modules/core
patch < /usr/src/asternic-stats-pro-2.3.11/FreePBX/fpbxmonitor210.diff
After the patch is applied, you must go to the FreePBX GUI and Apply Changes. That will modify the appropiate parts of the dialplan so the post call recording script is executed after a queue call recording finishes. To verify if the patch applied correctly, after applying changes in FreePBX you can run this command:
grep update_mix_mixmonitor /etc/asterisk/extensions_additional.conf
It should show some matches. If it returns empty, then the patch was not successful.
If you update the queue module in FreePBX, the patch will be lost, and recordings will cease to work. Whenever you update FreePBX queue module, you will need to re apply the proper patch.
Configuring the post call recording script
Since version 2.3.0, there are some settings you can use in Setup => Preferences menu to modify behaviour of the post call recording script. Usually you do not need to set anything different, but in some cases you might need to (like having a special folder to store recordings instead of using the default asterisk /var/spool/asterisk/monitor location, or if you want to convert recordings to mp3.
The parameters available in Setup => Preferences are listed below, as mentioned, you should not modify them unless you have special requirments in your environment/setup:
| Keyword | Description |
|---|---|
| recordings_convert_mp3 | If using the post call recording script and providing the lame convertion tool is installed, set the script to convert the recording to mp3 format |
| recordings_move | If using the post call recording script, set the script to move the recordings to the configured recordings_move_destination directory |
| recordings_move_destination | Destination directory to move recordings if the post call recording script is set and recordings_move is set to true |
| recordings_path | Recordings location/directory in the hardrive to perform the direct download |
If you want to convert recordings to MP3 format, be sure to set the recording format in the Queue configuration to wav (lowercase, do not chose WAV). You will also need to install lame, a command line program that can convert audio files to MP3 format. In Centos/RedHat based system you might find that tool on the EPEL repository, you could try the following set of commands: yum install epel-release followed by yum install lame
Manual configuration for older Asternic versions
This applies only for Asternic 2.2.7 or lower. If you use 2.3.0 or higher, please configure settings via the web interface as explained above.
If you installed copying files by hand, be sure that the script has execute permissions (mode 755). If in doubt, change it with the command:
chmod 755 /usr/local/parselog/update_mix_mixmonitor.pl
Also you have to be sure that the MySQL credentials inside the script are set correctly and match your configuration. Again, this is done automatically in a default install, only modify in case of a manual install/config.
# CONFIGURATION
# You have to set the proper database credentials
$config{'dbhost'} = 'localhost';
$config{'dbname'} = 'qstats';
$config{'dbuser'} = 'qstatsUser';
$config{'dbpass'} = 'qstatsPassw0rd';

# Destination directory for recordings
$config{'asterisk_spool'}  = "/var/spool/asterisk/monitor";
$config{'destination_dir'} = "/var/spool/asterisk/asternic";

# If you want \"wav\" recordings to be converted to .mp3
# It requires the lame tool to be installed.
$config{'convertmp3'} = false;
As you can see, not only you can set the MySQL credentials, but also you have the option to enable MP3 convertion. By default it is disabled, you can set convertmp3 to true to convert recordings to mp3 format. For that to work be sure that lame is installed. Also be sure that in your queue configuration the recording format is set to wav (not WAV, nor wav49 nor gsm), as the lame convertion tools only handles the wav format correctly.
Outbound call tracking
Asternic CCStats will report queue based activity. That means that only inbound calls that go into queues will be reported. However, there is a method to enable outbound call tracking by using a custom dialplan that intercepts outbound trunks calls under Issabel© / FreePBX© and updates the queue_log file with their activity.
The dialplan file is located in /usr/src/asternic-stats-pro-2.3.11/FreePBX/extensions_custom_asternic_outbound_freepbx.conf
You have to copy it over to your /etc/asterisk directory with the command:
cp /usr/src/asternic-stats-pro-2.3.11/FreePBX/extensions_custom_asternic_outbound_freepbx.conf /etc/asterisk
Then you have to include that dialplan into Asterisk. For doing so, you will have to use your favorite text editor to modify the
/etc/asterisk/extensions_custom.conf file and add at the end of it:
#include extensions_custom_asternic_outbound_freepbx.conf
Finally restart your asterisk dialplan:
asterisk -rx "dialplan reload"
The included dialplan will only track calls for extensions that have an account code set inside extension settings in Issabel© / FreePBX©. Extensions with no account code set won’t be tracked. We recommend to use the same account code for all the extensions you want to track, like “Outbound” or similar. Be sure not to chose a queue number/name as the account code as it will then add those calls to inbound queue calls, breaking some metrics like SLA or similar.
If you use the pinset module, or any other module that uses account codes, it will conflict with the included outbound track dialplan. However, it is possible to customize the dialplan a little bit to not use account codes but track all calls and using a unique name for the outbound queue like ‘Outbound’
Login in
Once Asternic CCStats PRO is installed and activated with either a trial or purchased code, you should point your browser to http://your.server/stats in order to log into the system. You will be presented with a login form similar to this:
The default administrator user is admin and the password is the one you supplied during installation make install
For Asternic versions older than 2.3.0, the default admin password is admin
If your admin user password is admin, you should change it next time you login to prevent unauthorized use of the software. Read the section Managing Users to see how to do that.
Once logged in, you will have access to the main dashboard, and at the top of it access to the Setup menu, where you will reach all the administrator management pages.
Resetting the admin password
If for whatever reason you do not remember a user password, it is possible to reset by accessing the server command line and using the MySQL command line client.
Suppose you want to change the password for the admin user to “new_password”, then you can run something like this:
mysql -u qstatsUser -pqstatsPassw0rd qstats -e "UPDATE users SET password=sha1('new_password') where login='admin'"
Setup Menu
When logged with a user with adminsitrator privilege, you will see the Setup tab in the top toolbar. A dropdown menu will appear with all available administrative pages, within them you will see “Preferences” where you can set many of the main system preferences.
Preferences
The preference page will let you add, modify or delete configuration parameters. The setting system in Asternic CCStats PRO is setup in a way you can define some configuration parameters as global or individualized to some particular element, by means of using a system similar to named arrays in programming where the main option name is set in the keyword field, the optional modificator in the parameter field, and the actual setting of that preference on the value field. Read the next section to understand basic usage of the setting system.
Language
As an example for basic configuration, you have the language keyword that can be used to change the interface to a different language. In order to change the language globally (for all users in the system), you have to edit the language keyword. Use the search box in the Preferences page and search for language, in the results then you can click the edit button to modify its contents and set it like this:
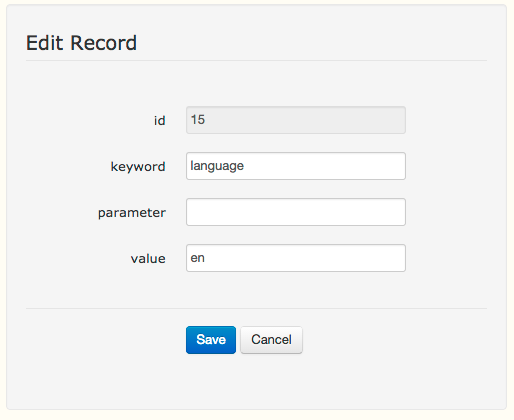
From now on, configuration paramters are going to be listed in text instead of images to make the guide more concise, like this:
keyword: language
parameter:
value: en
As the parameter is empty, in this case the language will be set to english for all users in the system. It is a global parameter. In the case of individualized settings, if there is no individual setting, the global will be used instead by default.
Supose you have created a new user named François, and you want him to see the reports in french instead. In that case, you will have to add a new language keyword and use the name of the user in the parameter field, like this:
keyword: language
paramter: François
value: fr
So now you have a global parameter language set to English, and a particular user language set to French. You can have any number of individual settings, like having a different language for every user in your system. Now, whenever François logs into Asternic, he will see the interface in French, but the rest of users like “admin” or any others you might have created, will use the global setting instead and see the interface in english.
Many configuration keywords can be set globally or to an individual entity by using the parameter field.
Time Zone
You might have your server in a particular location/timezone, and have users located in another location/part of the world with a different time zone than the server itself. And perhaps you want those users to see report date/times in their local timezone instead of the server timezone.
In those cases you can set an individual timezone for a user by setting the ‘timezone’ parameter, example:
keyword: timezone
parameter: john
value: +02:00
This setting will change datetime entries for john to be 2 hours ahead of the server date/time. If the parameter is left empty, then the setting will apply to all users (it will be global).
The format for the parameter is:
[+-]HH:MM
You can add or substract any number of hours or minutes for date time fields.
If you notice than report times are incorrect or wrong, do not fix them by using the Timezone parameter. Bad date/time means your system clock is not correct, or it might be that MySQL timezone is not correct. MySQL will inherit the system timezone found on boot. If you change your server timezone configuration and do not restart MySQL afterwards, all parsed data will have the timezone configured previous the change. You must restart MySQL if you change your server timezone so it gets in sync with your server/asterisk and log files.
Changing the Date Format
You can change the format of date fields for drill down data or detailed reports data by using the date_format parameter. This is a global fields, so parameter must be left empty. Example:
keyword: date_format
parameter:
value: %m-%d-%Y %H:%i:%s
The format string can be set using the MySQL date formatting options
To change date formats for other reports you will have to use the Report Designer instead.
Time Formats
There are several fields in the drill down or detailed reports that display a duration entry. Those formats can be customzied with their appropiate setting. You can change the following fields in those reports:
- wait_time_format
- To set the time format for wait times in reports. A wait time is the amount of time a caller waited in the queue
- avg_time_format
- Time format for average call duration on reports
- call_time_format
- Time format for the actual call duration on reports
- session_time_format
- Time format for the session time column on Agent reports.
The value on this formats uses the following syntax:
| Format | Value |
|---|---|
| HH | hours with a leading zero |
| MM | minutes with a leading zero |
| SS | seconds with a leading zero |
| mm | full minutes |
| ss | full seconds |
So a valid value could be:
HH:MM:SS
Given the duration of 1 hour, 10 minutes and 5 seconds, the above format will display: 01:10:05
If the format is set instead to:
mm
The same duration of 1 hour, 10 minutes and 5 seconds will display: 70
If the format is set to:
ss
Then the display will be: 4205
Week Mode
Some distribution reports include a week column. Depending on your needs, you might need to count weeks on a year in different ways, like starting a week on a Sunday, or perhaps on a Monday, etc. Asternic CCStats PRO lets you decide how to treat weeks by setting the week_mode keyword. Set the value for week_mode to any of this options to change the way it will count weeks:
Mode    First day of week       Range   Week 1 is the first week ...
0       Sunday                  0-53    with a Sunday in this year
1       Monday                  0-53    with more than 3 days this year
2       Sunday                  1-53    with a Sunday in this year
3       Monday                  1-53    with more than 3 days this year
4       Sunday                  0-53    with more than 3 days this year
5       Monday                  0-53    with a Monday in this year
6       Sunday                  1-53    with more than 3 days this year
7       Monday                  1-53    with a Monday in this year
So, if you wish weeks to be counted as per ISO 8601, where Monday is the first week of the day, weeks are counted from offset 1 and the first week is the one where january 1st has at least 4 days, then set the value to 3:
keyword: week_mode
parameter:
value: 3
Decimal Places
Whenever a float number is displayed on reports, you might want to decide how many decimal places to show. You can set that with the decimal_places keyword:
keyword: decimal_places
parameter:
value: 2
This setting is global, parameter field must be left empty.
CSV Separator
Separator character to use in CSV export files. The default value is a comma , so CSV export files will open correctly on Excel and friends.
If you use LibreOffice/OpenOffice you might need to change it to a semicolon ; instead:
keyword: csv_separator
parameter:
value: ;
This setting is global, parameter field must be left empty.
Agent Dictionary
Some times your agent names are logged in the queue_log file with their device or number, instead of they real name. Something like Agent/1000, or SIP/300. Asternic CCStats PRO lets you add dictionary entries to rename them to whatever you like. For example:
keyword: dict_agent
parameter: Agent/100
value: John Doe
You can add as many entries as you like, the parameter is mandatory and should match the agent name you want to change in the reports.
You should not use an existing agent name for a dictionary entry, otherwise you will end up with TWO selections for that agent on reports. And data will not be grouped. This feature is not for grouping data, but just chaging a display name.
Queue Dictionary
The same as the agent dictionary, you can rename queues using dictionary entries for them. For example:
keyword: dict_queue
parameter: 100
value: Support
The above entry will rename all appeareances of queue 100 to Support on the reports.
Call Flow
If you setup outbound call tracking using the builtin dialplan provided or a variation of it, you might want to separate inbound from outbound reports as some of the terminology, like an ABANDON, does not make sense when dealing with outbound calls.
To do so, you can use the call_flow setting, where you indicate which queues should be treated as outbound ones. Once this is setup, the Distribution reports will be separated between regular (inbound) and outbound queues:
keyword: call_flow
parameter: queue_name
value: outbound
The parameter field is mandatory, and must match the queue name you want to set as an outbound queue.
Report Time Frames
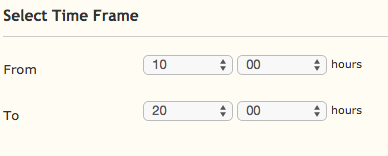
Some times a Call Center runs on shifts or turns, or in specific time intervals. It is possible to define in the Home tab the start and end hours for a report so you can get statistics for that particular time frame. If you always run reports with a specific start and end hours, you can configure it so it always shows those times instead of the beginning and end of the day. The parameters are:
keyword: default_start_hour
parameter:
value: 10:00
keyword: default_end_hour
parameter:
value: 20:00
The above example will select the initial time frame automatically whenever you launch a report:
Distribution Interval
The distribution by hour report shows call distribution every 60 minutes. Some times you need a smaller break down on that report, like showing calls every 15 minutes instead of 60. In order to achieve that you have to user the distribution_interval setting:
keyword: distribution_interval
parameter:
value: 15
This setting accept an integer value in minutes to use for the break down of Distribution by Hour report.
Initial shown report
When you select a set of agents, queues and days to run a report in the Home tab, you are directed automaticaly to the Distribution reports. That behaviour can be changed by using the first_page setting. You can assign a different initial page per user by filling the parameter value with the user name, or leave it as global when parameter is empty. For example, to set the user ‘alfonso’ to load the real time view directly, you can set it like this:
keyword: first_page
parameter: alfonso
value: realtime.php
The main Tabs in Asternic that can be used as first pages are:
- distribution.php
- answered.php
- unanswered.php
- realtime.php
- agent.php
- search.php
SLA Thresholds
SLA means ‘Service Level Agreement’. It is a metric used to measure the efficiency of your call center based on how much time callers have to wait to be connected to a representative. Distribution reports in Asternic includes by default an SLA column. That column uses a formula (that can be changed in the Report Designer) to compute that metric. That formula also needs to know what is the waiting threshold to consider a call inside or outside SLA.
In Asternic you can configure that threshold for all calls depending on their final disposition: answered, abadnoned, unanswered and transferred. You can define a separate waiting threshold for each disposition. In general, the most important one is the answered one:
keyword: sla_answered
parameter:
value: 10
In the above example, we are setting the global answered service level threshold to 10 seconds. Any answered call that is connected to an agent within 10 seconds will meet the SLA.
It is possible to define individual sla thresholds per queue, by using the parameter field:
keyword: sla_answered
parameter: 100
value: 20
In this case, queue 100 will have 20 seconds defined for the SLA threshold.
As mentioned before, you can define also SLA for other disposition by using: sla_abandoned, sla_unanswered or sla_transferred
The default formula used for the SLA column in distribution reports is:
(ANSWERED_SLA / RECEIVED)*100
Where ANSWERED_SLA are all the calls answered within the sla_answered setting and RECEIVED is the total number of calls offered no matter their disposition (including abandoned calls)
You can change that formula using the Report Designer
There are also 2 reports in Asternic that will break down calls based on their waiting time, one in the Answered tab and the other in the Unanswered tab. This report can also be modified to break those calls into any interval (in seconds), and for any number of steps. To change the interval and steps, in Setup / Preferences you should use something like this:
keyword: sla_interval
parameter:
value: 10
keyword: sla_steps
parameter:
value: 15
The above setup will create a SLA report breaking calls every 10 seconds, and in 15 steps.
Report Designer
Under construction…
Users
Asternic CCStats PRO includes a powerful user authentication and authorization system in place. Authentication is done using a username and a password, while authorization is managed using access tokens and an ACL system. Users can also be limited to see certain queue or agents in their reports, so you can separate deparments or different tenants quite easily.
The first this you will see when editing users is the administration screen:
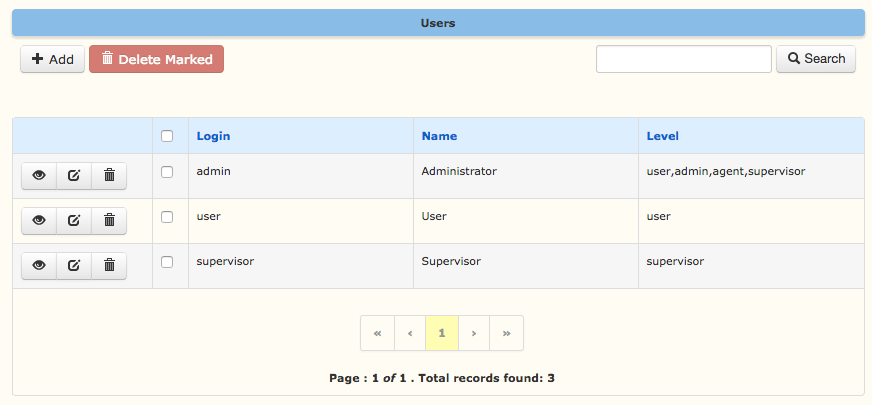
By default there are 3 users on the system, you can change them or remove them if you do not plan to use them. They are there as a sample.
It is very important for you to change the admin password as soon as the software is installed.
You can click the edit action icon on any entry to modify it:
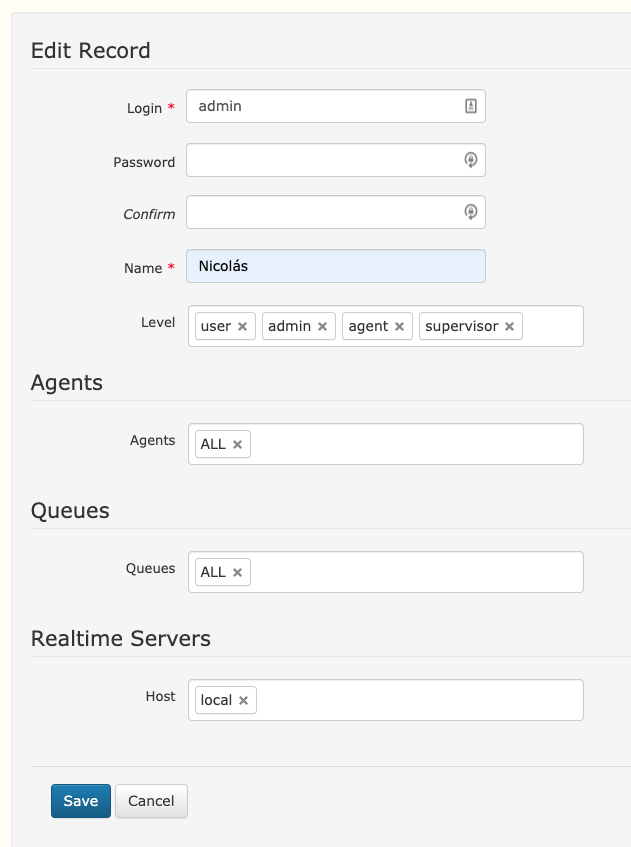
As you can see, modifying a user password, or the allowed agents or queues is quite straightforward.
You can also select the realtime servers the user will be able to monitor. The standard license allows you to monitor up to one server that is named “local”. If you have extended licenses, you might be able to add more realtime servers and assign/allow servers to individual users from here.
The Level field lets you assign Access Tokens. To give full access to a system, you usually need to assign all available tokens to a given user. A token grants access to resources based on the Access Control definitios.
Access Control
Under construction…
Translations
Under construction…
Schedules/Alerts
Asternic Call Center Stats PRO can be programmed to send CSV or PDF reports via email. There are several components that must be configured right for this feature to work.
Cron Job Entry
In order for the “schedule” to work you need to set up a Cron Job on your operating system. The exact line to use and command to add is shown on the very same Scheduled Reports page. It will vary from system to system as the software will use your very own hostname or IP address when shoing that command, so it is best to look at the bottom of the page in your setup to get the exact command to use, it will be similar to this:
* * * * * /usr/bin/php /var/www/html/stats/sched_check.php
To bring the crontab editor up, from your server command line, as root, type:
crontab -e
You can paste the former line into the editor and save it, to setup the cron job on your system.
Add/Edit Schedule Report
The Schedule Report page is divided vertically in two sections. The left most section is the one where you can add/edit a scheduled report or alert, it looks like this:
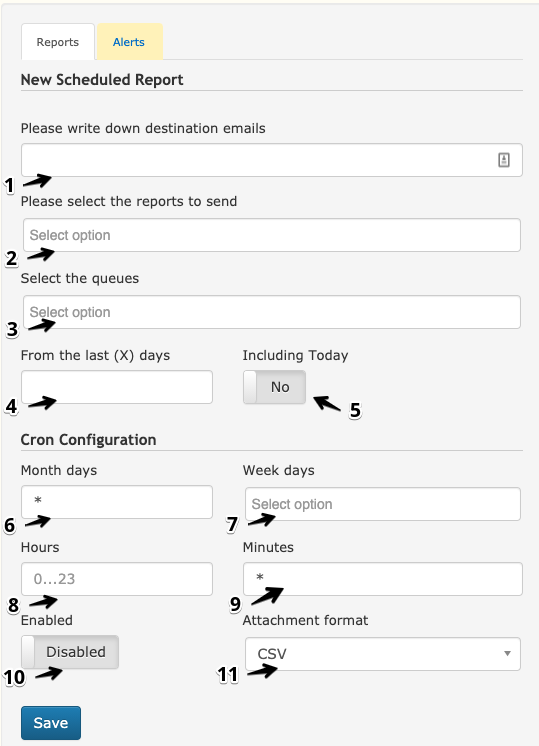
(1) Email Address : Email address to send the report to. If you want to send to multiple addresses, then use a comma to enumarate, without leaving any spaces between them, for example: me@example.com,him@example.com
(2) Reports to Send : This field will present you with a drop down list of available reports to send. If the drop down is empty, check your REST user configuration (described in the previous section)
(3) Queus : This field will present you with a drop down list of available queues. If you want to limit the report to a specific queue, select one here. Or leave it as ‘all’ to get data for all available queues. If the drop down is empty, check your REST user configuration (described in the previous section).
(4) From the last (X) days : You can select the number of days to include in the report. If you want to receive daily reports, then you should select ONE day. For weekly reports chose SEVEN, etc. If you want to send a monthly report, set it to 30 days and be sure to set month days to 1. That way Asternic will send the whole month no matter if it has 31, 30 or less days.
(5) Include Today: If this swith is on, the report will include same day data as the moment it runs the cron job. If you want to get a nightly report for the day, to be sent before midnight, you might want to toggle this on so you get data for that same day.
(6) Month days : You can select the month day in which the report should be sent, like the 1st of each month, the 15th, etc. You can use a comma separated list of days to send the report on specific days. If you use an asterisk (*) then the report will be send using other time/date conditions, and not checking for the day of the month.
(7) Week days : Same as month days, you can select a week day, like Monday, Tuesday, etc. You can select multiple days also. If you want a report to be sent daily except for saturdays and sundays, then select days from Monday to Friday.
(8) Hours : At which hour you want the report to be sent. It must be set together with the Minutes entry besides it. For example, if you want the report to be sent at 4:15PM, set hours to 16 and Minutes to 15
(9) Minutes : At which minute you want the report to be sent. It must be set together with the Hours entry besides it. For example, if you want the report to be sent at 4:15PM, set hours to 16 and Minutes to 15
(10) Enable : You can enable or disable a report from here. Disabled reports won’t be send out when the scheduled time comes.
(11) Attachment format : You can select the attachment format for the emailed reports: CSV or PDF. PDF email reporting requires wkhtmltopdf to be installed. This tool is installed by default when doing
make installormake upgrade. If you install by other means, be sure you have that installed on your system.
Common Administration Tasks
Here is a brief list of common administration taks you might need to perform.
Purging Data
Some times you want to start from scracth and remove all of your data, either because you do not need historic data, or because you had some test calls for the initial PBX setup and you do no longer need that information. In those cases, you can clean al of the information by passing the --purge command line option to asterniclog.
Purging the tables will remove all activity and every queue and agent that is filled in the database. If you do not have the source queue_log files there is no way to recover that information after
purging takes place.
In order to purgue the database, be sure the asterniclog service is not running first, so you should stop it:
service asterniclog stop
And then run the asterniclog command with the --purge parameter, like this:
/usr/local/parselog/asterniclog -u qstatsUser -p qstatsPassw0rd -d qstats -h localhost --purge
You will have to answer yes to actually purgue the information. Also, be sure to set the corret MySQL credentials if you have changed it from defaults.
Purging data will remove call activity data and agent and queues data, but it won’t clear your preferences, users and permissions.
Reparsing old logs
Some times the log parser stops for some reason for any number of days, and you might notice a gap in your data when running reports, due to some rotated queue_log files not being processed. In those cases, you can use the -r command line option to asterniclog in order to reparse the file and insert entries even if they are older than the most current one in the database.
For example:
/usr/local/parselog/asterniclog -u qstatsUser -p qstatsPassw0rd -d qstats -h localhost -l /var/log/asterisk/queue_log-20150101 -c -r
The above command will reparse -r the queue_log-20150101 file, converting -c Local device to queue member names for FreePBX based systems.
Some distributions, like the FreePBX distro, have a daily rotation policy for the queue_log file.·
We strongly advise to change the rotation policy to a monthly basis. That will make system administration much simpler, and you will also keep a log file backup of critical data in the case the MySQL datbase becomes corrupt.
The queue_log file is not huge, and there is absolutely no point in rotating it daily and keeping just 7 or 30 days worth of log data.
So if your log files are rotated daily, look for the file in /etc/logrotate.d that has the queue_log section and change daily to monthly
Enabling Spy/Coatch/Steal options in Realtime
Before enabling these features there is one important consideration to take into account: Asternic does not perform any audio processing. It is not a phone or webphone. It will launch a call that you will have to answer with your phone (being soft or hard phone, it does not matter).
So, in order to launch a call, Asternic needs to know what device to use. And for stealing a call (pick a call from an agent to take it yourself, usually a supervisor), you need to know your dialplan extension and context. Both the device and extension@context are assigned per user. That means that if you have multiple supervisors, you will have to create one separate user for each under Setup => Users.
Assuming you have a user named john, that uses the device SIP/200 and his extension is 200@from-internal, here is what you need to do: go to Setup => Preferences menu and add or modify:
keyword: realtime_spy_device
parameter: john
value: SIP/200
That bit will indicate Asternic to originate a call from SIP/200 anytyme john attempts to spy or coach on a given call. Notice the parameter header containing the username, this way you can assign different devices to different users, just by adding a new realtime_spy_device entry with a different parameter indicating every user you might want to give the ability to.
keyword: realtime_spy_extension
parameter: john
value: 200@from-internal
This one will enable call stealing, and will redirect any active call to extension 200 and context from-internal.
Optionally, you can tweak behaviour for Spy and Coach options by passing parameters to it. Asternic will use ChanSpy for both, and ChanSpy has lots of modifiers you can use to alter the behaviour, like ‘q’ to disable the initial beep, etc. You can see all of chanspy options for your current Asterisk version by running:
asterisk -rx 'core show application chanspy'
For passing particular options for call spy, you must add (or modify) in Setup => Preferences
keyword: realtime_spy_options
parameter: john
value: q
Same for coach, that is chanspy with the ‘whisper’ options being passed, so the supervisor can talk to the agent without the caller to listen to what he says:
keyword: realtime_coach_options
parameter: john
value: w
Here is a screencast we made showing you how to do it:
Setting visual alarms in Realtime
The Real Time view in Asternic lets you highlight entries when they reach certain condition. Those are called ‘alarms’, that can be used to show whenever an agent as paused for too long, or a waiting call is sitting there for ages, etc.
Here is a list of setting you can enter into Setup => Preferences to configure these alarms:
realtime_alarm_call_duration
Alarm in seconds for call duration in the realtime view. Can be set per queue by setting the parameter to the queue name. Suppose you want to highlight agents that are in a call for more than 10 minutes on queue Support, in that case you should add:
keyword: realtime_alarm_call_duration
parameter: Support
value: 600
realtime_alarm_last_call
Alarm in seconds for the last call information in the realtime view. Can be set per queue by setting the parameter to the queue name. The last call column shows the last time that agent took a call, so you can see how long that agent has been idle. If you want to trigger a visual alarm for that, you can add it into Setup => Preferences like the rest of alarm settings. The following example will highlight the last call cell for any agent that had not received a call in the last 20 minutes or more:
keyword: realtime_alarm_last_call
parameter: Support
value: 1200
realtime_alarm_pause_duration
Alarm in seconds for pause/break duration in the realtime view. Can be set per queue by setting the parameter to the queue name. This one lets you highlight agents that are paused for long times. As all other alarms, the value is expressed in seconds:
keyword: realtime_alarm_pause_duration
parameter:
value: 300
In the above example, if an agent is paused for more than 5 minutes (300 seconds), on any queue (empty parameter), it will be highlihgted.
realtime_alarm_pause_duration_type
Alarm in seconds for pause/break duration in the realtime view. Can be set per reason by setting the parameter to the type/reason of the pause. This one is really similar to the above pause alarm, but with the addition that you can set the pause reason/type in the parameter field, instead of the queue. So you can set up a visual alarm if pause reason is ‘Bathroom’ for example:
keyword: realtime_alarm_pause_duration_type
parameter: Bathroom
value: 300
realtime_alarm_wait_count
Alarm (in number of calls) for calls waiting in a queue in the realtime view. This particular one is not based on duration, but on number of calls waiting on a queue. If you want to show it for a particular queue, fill the parameter header with the queue name, if parameter is left empty, it will be a global value applied to all queues. For example, to show an alarm whenever there are more than 4 calls waiting:
keyword: realtime_alarm_wait_count
parameter:
value: 5
realtime_alarm_wait_duration
Alarm in seconds for call waiting duration in the realtime view. Can be set per queue by setting the parameter to the queue name.
realtime_alarm_row_color
Background row color when a value is in alarm in the realtime view.
realtime_alarm_threshold
Threshold (in percentage) from which to start coloring in alarm calls in the realtime view.
REST API
Overview
Call Center Stats PRO includes a web service using the REST technology, simple ad powerfull. You can get all the available reports and functions available in the CCStats PRO User interface but in JSON format.
Calling as REST function is just opening an URL as the following:
http://your-server/stats/rest/index.php?entity=EEEEEEEE
Note: your-server is the ip or domain where you have Asternic Call Center PRO installed, stats is the web directory. EEEEEE means the entity or rest function available.
The following are the available list of functions:
Reports
Realtime
Queues
Agents
Call
Search
Now we know the different entities we can use with Call Center Stats PRO, we will explain each one and how to take advantage of this powerfull tool.
It is importan to know that you can test all your REST connections and functions explained with a regular web browser. You will see results returned as a web page in JSON format.
Asternic Call Center Stats PRO will prompt for username and password defined in Setup => Users and will restrict the information returned as you configured the username.
ENTITY : REPORTS
You can call the entity this way:
http://server/stats/rest/index.php?entity=reports
the URL above will show available reports you can ask for. You will see something like:
{
	"data": [
		{
			"report" :    "answered_calls_detail"

		},
		{
			"report" :    "answered_calls_by_queue"

		},
		{
			"report" :    "answered_calls_by_agent"

		},
		{
			"report" :    "answered_calls_by_url"

		},
		{
			"report" :    "answered_calls_by_did"

		},
		{
			"report" :    "answered_calls_by_holdtime"

		},
		{
			"report" :    "answered_calls_by_event"
		}
	]
}
You may choose any report and use it this way:
http://server/qstats/rest/index.php?entity=reports/answered_calls_detail
or any other report as the image shows. This access will show you data from TODAY as it has not been defined any date variable or date range variables. If there is no data to show, you would see something like:
{
"page":"1",
"total":"0",
"records":"0",
	"rows": [
	]
}
There are different variables that you can use with the GET method to show conditional results for the entity:
start: start date in the format yyyy-mm-dd. Start date in a range. Example: ?entity=reports/answered_calls_detail&start=2012-08-01end: end date in the format yyyy-mm-dd. End date in range. Ex.: ?entity=reports/qnswered_calls_detail&start=2012-08-01&end=2012-08-02secondstart: hour of day in seconds to show the start hour in a range. Ex.: ?entity=reports/answered_calls_detail&secondsstart=2016551secondsend: hour of day in seconds to show the end hour in a range. Ex.: ?entity=reports/answered_calls_detail&secondsend=2019999agent: for reports ‘_by_agent’, you can filter by agent.queue: for reports ‘_by_queue’, you can filter by queue.
You can use all of these variables together for an accurate report query. Here is an example:
http://server/stats/rest/index.php?entity=reports/answered_calls_by_queue&start=2016-08-01&end=2016-08-10
Result:
{
"page":"1",
"total":"1",
"records":"6",
	"rows": [
		{
			"Queue" :    "2000",
			"Received" :    "165",
			"% Calls" :    "71.12"
		},
		{
			"Queue" :    "2001",
			"Received" :    "3",
			"% Calls" :    "1.29"
		},
		{
			"Queue" :    "2002",
			"Received" :    "60",
			"% Calls" :    "25.86"
		},
		{
			"Queue" :    "2003",
			"Received" :    "2",
			"% Calls" :    "0.86"
		},
		{
			"Queue" :    "2006",
			"Received" :    "1",
			"% Calls" :    "0.43"
		},
		{
			"Queue" :    "2007",
			"Received" :    "1",
			"% Calls" :    "0.43"
		}
	]
}
Another example of answered_calls _detail that shows the detailed calls:
http://server/stats/rest/index.php?entity=reports/answered_calls_detail&start=2012-08-01&end=2012-08-10
Result:
{
"page":"1",
"total":"1",
"records":"232",
	"rows": [
		{
			"datetime" :    "01-08-2016 10:31:21",
			"queue" :    "2002",
			"agent" :    "Travis Spencer",
			"callerid" :    "4787574818",
			"event" :    "COMPLETEAGENT",
			"waitTime" :    "10",
			"ringTime" :    "10",
			"callTime" :    "94",
			"agentName" :    "Travis Spencer",
			"queueName" :    "2002",
			"recording" :    "test.wav",
			"uniqueid" :    "1327498260.2637",
			"callflow" :    "/asternicjquery/rest/index.php?entity=call/1327498260.2637",
			"url" :    "www.lala.com",
			"did" :    ""
		},
		{
			"datetime" :    "01-08-2016 10:53:45",
			"queue" :    "2002",
			"agent" :    "Travis Spencer",
			"callerid" :    "2568314606",
			"event" :    "COMPLETEAGENT",
			"waitTime" :    "13",
			"ringTime" :    "13",
			"callTime" :    "63",
			"agentName" :    "Travis Spencer",
			"queueName" :    "2002",
			"recording" :    "test.wav",
			"uniqueid" :    "1327499602.2681",
			"callflow" :    "/asternicjquery/rest/index.php?entity=call/1327499602.2681",
			"url" :    "www.lala.com",
			"did" :    ""
		},
		{
			"datetime" :    "01-08-2016 11:14:02",
			"queue" :    "2000",
			"agent" :    "Regina Spek",
			"callerid" :    "5082817600",
At the result above, note a line in the results named ‘callflow’ that shows a link to the ‘call’ entity that will be detail later in this documentation. The ‘call’ entity shows information detailed for a particular call.
ENTITY :QUEUES
Calling the entity this way:
http://server/stats/rest/index.php?entity=queues
will show the available queues populated in Call Center Stats PRO. You will see something like this:
{
	"data": [
		{
			"queue_id" :    "2",
			"queue" :    "2000",
			"queue_name" :    "2000"

		},
		{
			"queue_id" :    "8",
			"queue" :    "2001",
			"queue_name" :    "2001"

		},
		{
			"queue_id" :    "4",
			"queue" :    "2002",
			"queue_name" :    "2002"

		},
		{
			"queue_id" :    "5",
			"queue" :    "2003",
			"queue_name" :    "2003"

		},
		{
			"queue_id" :    "1",
			"queue" :    "2005",
			"queue_name" :    "2005"

		},
		{
			"queue_id" :    "3",
			"queue" :    "2006",
			"queue_name" :    "2006"

		},
		{
			"queue_id" :    "6",
			"queue" :    "2007",
			"queue_name" :    "2007"

		},
		{
			"queue_id" :    "9",
			"queue" :    "2009",
			"queue_name" :    "2009"

		},
		{
			"queue_id" :    "-1",
			"queue" :    "ALL",
			"queue_name" :    "ALL"

		},
		{
			"queue_id" :    "7",
			"queue" :    "NONE",
			"queue_name" :    "NONE"

		}
	]
}
You can choose an specific queue calling the entity this way:
http://server/stats/rest/index.php?entity=queues/XX
being XX the field id from queue_id that you can see at last image.
{
	"data": [
		{
			"queue_id" :    "6",
			"queue" :    "2007",
			"queue_name" :    "2007"

		}
	]
}
ENTITY : AGENTS
Calling the entity this way:
http://server/stats/rest/index.php?entity=agents
will show total agents populated in Call Center Stats PRO. You will see something like this:
{
	"data": [
		{
			"agent_id" :    "-1",
			"agent" :    "ALL",
			"agent_name" :    "ALL"

		},
		{
			"agent_id" :    "6",
			"agent" :    "Andy Fisher",
			"agent_name" :    "Andy Fisher"

		},
		{
			"agent_id" :    "16",
			"agent" :    "B.Obama",
			"agent_name" :    "B.Obama"

		},
		{
			"agent_id" :    "14",
			"agent" :    "Boris G.",
			"agent_name" :    "Boris G."

		},
		{
			"agent_id" :    "7",
			"agent" :    "Daniel L.",
			"agent_name" :    "Daniel L."

		},
		{
			"agent_id" :    "11",
			"agent" :    "David Haseholf",

		......data continues......
You can choose a specific agent calling the entity this way:
http://server/stats/rest/index.php?entity=agents/XX
being XX the field id of agent_id that you can see in latest figure.
###ENTITY : CALL
The call entity shows detailed information regarding a call identified by the unique_id variable from the call itself.
Use the entity this way:
http://server/stats/rest/index.php?entity=call/13448674833.5314
This call may return something like this:
{
	"totalpages": "1",
	"currpage": "1",
	"totalrecords": "3",
	"data": [
		{
			"id" :    "1",
			"uniqueid" :    "1327498260.2637",
			"datetime" :    "2016-08-01 10:31:11",
			"queue" :    "2002",
			"agent" :    "NONE",
			"event" :    "ENTERQUEUE",
			"info1" :    "www.lala.com",
			"info2" :    "4787574818",
			"info3" :    "",
			"info4" :    "",
			"info5" :    "Sale",
			"agentName" :    "NONE",
			"queueName" :    "2002"

		},
		{
			"id" :    "2",
			"uniqueid" :    "1327498260.2637",
			"datetime" :    "2016-08-01 10:31:21",
			"queue" :    "2002",
			"agent" :    "Travis Spencer",
			"event" :    "CONNECT",
			"info1" :    "10",
			"info2" :    "1327498271.2638",
			"info3" :    "7",
			"info4" :    "",
			"info5" :    "",
			"agentName" :    "Travis Spencer",
			"queueName" :    "2002"

		},
		{
			"id" :    "3",
			"uniqueid" :    "1327498260.2637",
			"datetime" :    "2016-08-01 10:32:55",
			"queue" :    "2002",
			"agent" :    "Travis Spencer",
			"event" :    "COMPLETEAGENT",
			"info1" :    "10",
			"info2" :    "94",
			"info3" :    "1",
			"info4" :    "",
			"info5" :    "",
			"agentName" :    "Travis Spencer",
			"queueName" :    "2002"

		}
	]
}
In this image you can see detailed events for the call identified with the unique_id field. Forst row shows the ENTERQUEUE event, the next shows CONNECT event and finally the COMPLETECALLER event.
NOTE
The asterisk queue application generates a log with several events that indicates statuses and actions during all the queue calls received. Our inline help on each report explains every event and the fields related.
ENTITY : REALTIME
The realtime entity takes an instant picture of your asterisk queue status, agent status, stats for today and more. Calling the entity is simple as:
http://server/stats/rest/index.php?entity=realtime
You may see something like the following picture:
{
"waiting calls": {
	"OUTBOUND": {
	}
,
	"Test": {
	}
,
	"saliente": {
	}
,
	"100": {
		"1": {
			"calleridNum": "asterisk",
			"calleridName": "asterisk",
			"waitTime": "2"
		}
	}
,
	"101": {
	}
,
	"102": {
		"1": {
			"calleridNum": "32080805",
			"calleridName": "32080805",
			"waitTime": "17"
		}
	}
,
	"103": {
	}
	}
,
"summary": {
	"queue": {
		"OUTBOUND": {
			"Waiting": "0",
			"Agents": "0",
			"Penalty": "0",
			"Logged Off": "0",
			"Busy": "0",
			"Paused": "0",
			"Answered": "0",
			"Unanswered": "0",
			"Abandoned": "0",
			"Abandon Rate": "0",
			"Avg Wait": "0",
			"Avg Duration": "0",
			"Max. wait time": "0"
		},
		"Test": {
			"Waiting": "0",
			"Agents": "0",
			"Penalty": "0",
			"Logged Off": "0",
			"Busy": "0",
			"Paused": "0",
			"Answered": "0",
			"Unanswered": "0",
			"Abandoned": "0",
			"Abandon Rate": "0",
			"Avg Wait": "0",
			"Avg Duration": "0",
			"Max. wait time": "0"
		},
		"saliente": {
			"Waiting": "0",
			"Agents": "0",
			"Penalty": "0",
			"Logged Off": "0",
			"Busy": "0",
			"Paused": "0",
			"Answered": "0",
			"Unanswered": "0",
			"Abandoned": "0",
			"Abandon Rate": "0",
			"Avg Wait": "0",
			"Avg Duration": "0",
			"Max. wait time": "0"
		},
		"100": {
			"Waiting": "1",
			"Agents": "1",
			"Penalty": "0",
			"Logged Off": "1",
			"Busy": "0",
			"Paused": "0",
			"Answered": "0",
			"Unanswered": "0",
			"Abandoned": "0",
			"Abandon Rate": "0",
			"Avg Wait": "0",
			"Avg Duration": "0",
			"Max. wait time": "2"
		},
		"101": {
			"Waiting": "0",
			"Agents": "1",
			"Penalty": "0",
			"Logged Off": "0",
			"Busy": "0",
			"Paused": "0",
			"Answered": "0",
			"Unanswered": "0",
			"Abandoned": "0",
			"Abandon Rate": "0",
			"Avg Wait": "0",
			"Avg Duration": "0",
			"Max. wait time": "0"
		},
		"102": {
			"Waiting": "1",
			"Agents": "1",
			"Penalty": "1",
			"Logged Off": "0",
			"Busy": "0",
			"Paused": "0",
			"Answered": "0",
			"Unanswered": "0",
			"Abandoned": "0",
			"Abandon Rate": "0",
			"Avg Wait": "0",
			"Avg Duration": "0",
			"Max. wait time": "17"
		},
		"103": {
			"Waiting": "0",
			"Agents": "0",
			"Penalty": "0",
			"Logged Off": "1",
			"Busy": "0",
			"Paused": "0",
			"Answered": "0",
			"Unanswered": "0",
			"Abandoned": "0",
			"Abandon Rate": "0",
			"Avg Wait": "0",
			"Avg Duration": "0",
			"Max. wait time": "0"
		}

	}
}
,{
"waiting calls": {
	"OUTBOUND": {
	}
,
	"Test": {
	}
,
	"saliente": {
	}
,
	"100": {
		"1": {
			"calleridNum": "asterisk",
			"calleridName": "asterisk",
			"waitTime": "2"
		}
	}
,
	"101": {
	}
,
	"102": {
		"1": {
			"calleridNum": "32080805",
			"calleridName": "32080805",
			"waitTime": "17"
		}
	}
,
	"103": {
	}
	}
,
"summary": {
	"queue": {
		"OUTBOUND": {
			"Waiting": "0",
			"Agents": "0",
			"Penalty": "0",
			"Logged Off": "0",
			"Busy": "0",
			"Paused": "0",
			"Answered": "0",
			"Unanswered": "0",
			"Abandoned": "0",
			"Abandon Rate": "0",
			"Avg Wait": "0",
			"Avg Duration": "0",
			"Max. wait time": "0"
		},
		"Test": {
			"Waiting": "0",
			"Agents": "0",
			"Penalty": "0",
			"Logged Off": "0",
			"Busy": "0",
			"Paused": "0",
			"Answered": "0",
			"Unanswered": "0",
			"Abandoned": "0",
			"Abandon Rate": "0",
			"Avg Wait": "0",
			"Avg Duration": "0",
			"Max. wait time": "0"
		},
		"saliente": {
			"Waiting": "0",
			"Agents": "0",
			"Penalty": "0",
			"Logged Off": "0",
			"Busy": "0",
			"Paused": "0",
			"Answered": "0",
			"Unanswered": "0",
			"Abandoned": "0",
			"Abandon Rate": "0",
			"Avg Wait": "0",
			"Avg Duration": "0",
			"Max. wait time": "0"
		},
		"100": {
			"Waiting": "1",
			"Agents": "1",
			"Penalty": "0",
			"Logged Off": "1",
			"Busy": "0",
			"Paused": "0",
			"Answered": "0",
			"Unanswered": "0",
			"Abandoned": "0",
			"Abandon Rate": "0",
			"Avg Wait": "0",
			"Avg Duration": "0",
			"Max. wait time": "2"
		},
		"101": {
			"Waiting": "0",
			"Agents": "1",
			"Penalty": "0",
			"Logged Off": "0",
			"Busy": "0",
			"Paused": "0",
			"Answered": "0",
			"Unanswered": "0",
			"Abandoned": "0",
			"Abandon Rate": "0",
			"Avg Wait": "0",
			"Avg Duration": "0",
			"Max. wait time": "0"
		},
		"102": {
			"Waiting": "1",
			"Agents": "1",
			"Penalty": "1",
			"Logged Off": "0",
			"Busy": "0",
			"Paused": "0",
			"Answered": "0",
			"Unanswered": "0",
			"Abandoned": "0",
			"Abandon Rate": "0",
			"Avg Wait": "0",
			"Avg Duration": "0",
			"Max. wait time": "17"
		},
		"103": {
			"Waiting": "0",
			"Agents": "0",
			"Penalty": "0",
			"Logged Off": "1",
			"Busy": "0",
			"Paused": "0",
			"Answered": "0",
			"Unanswered": "0",
			"Abandoned": "0",
			"Abandon Rate": "0",
			"Avg Wait": "0",
			"Avg Duration": "0",
			"Max. wait time": "0"
		}

	}
}
,
"agents": {
	"OUTBOUND": {
	},
	"Test": {
	},
	"saliente": {
	},
	"100": {
	},
	"101": {
	},
	"102": {
	},
	"103": {
	}
	}
}
You will mostly see in a JSON format the updated queues and agents status in that moment. You may want to refresh it every 5 or 10 seconds in order to update the data.
ENTITY : SEARCH
This entity allows you to search the entire database for rows that match using the available variables.
http://server/stats/rest/index.php?entity=search&start=2016-08-01&end=2016-08-02&agent=Travis%20Spencer
This address may return information like the following:
{
"page":"1",
"total":"1",
"records":"6",
	"rows": [
		{
			"firstEvent" :    "ENTERQUEUE",
			"overflow" :    "1",
			"uniqueid" :    "1327498260.2637",
			"callerid" :    "4787574818",
			"dateStart" :    "2016-08-01 10:31:11",
			"dateEnd" :    "2016-08-01 10:32:55",
			"event" :    "COMPLETEAGENT",
			"agent" :    "Travis Spencer",
			"queue" :    "2002",
			"waitTime" :    "10",
			"talkTime" :    "0",
			"combinedWaitTime" :    "104",
			"totalDuration" :    "104",
			"recordingFilename" :    "test.wav",
			"agent_name" :    "Travis Spencer",
			"queue_name" :    "2002",
			"callflow" :      "/asternicjquery/rest/index.php?entity=call/1327498260.2637"

		},
		{
			"firstEvent" :    "ENTERQUEUE",
			"overflow" :    "1",
			"uniqueid" :    "1327499602.2681",
			"callerid" :    "2568314606",
			"dateStart" :    "2016-08-01 10:53:32",
			"dateEnd" :    "2016-08-01 10:54:48",
			"event" :    "COMPLETEAGENT",
			"agent" :    "Travis Spencer",
			"queue" :    "2002",
			"waitTime" :    "13",
			"talkTime" :    "0",
			"combinedWaitTime" :    "76",
			"totalDuration" :    "76",
			"recordingFilename" :    "test.wav",
			"agent_name" :    "Travis Spencer",
			"queue_name" :    "2002",
			"callflow" :      "/asternicjquery/rest/index.php?entity=call/1327499602.2681"

		},
		{
			"firstEvent" :    "ENTERQUEUE",
			"overflow" :    "1",
			"uniqueid" :    "1327504603.2835",
			"callerid" :    "4234324839",
			"dateStart" :    "2016-08-01 12:16:53",
			"dateEnd" :    "2016-08-01 12:17:39",
			"event" :    "COMPLETEAGENT",
			"agent" :    "Travis Spencer",

			......data continues......
White Labeling
It is possible to white label the application with a standard license, just by changing a few configuration files.
Application Name and Logo
Asternic Call Center Stats PRO name and logo can be changed by simply modifying the two corrsponding settings in
the configuration file located in /var/www/html/stats/config.php. Open it up with your favorite text editor
and look for $ReportTitle and $ReportLogo:
// Application title & logo
$ReportTitle = "Asternic Call Center Stats";
$ReportLogo  = "/images/asternic_logo.png";
You can change them to whatever you want to have the page and application title and logo modified.
Email Report Subject and Filenames
Another place where “Asternic” appears by default is in scheduled emails. You can pretty much tweak mail contents using the web GUI. Just log into Asternic as administrator, and go to Setup => Preferences where you might want to set these two settings as their default value shows the Asternic brand in them:
- mail_pdf_filename
- This setting will let you set the actual attachment filename for PDF based scheduled reports
- mail_header_image
- This setting will let you specify an image that will be used in the mail header, similar to the ReportLogo setting in config.php but for emails.
Custom Colors
You can tweak colors using CSS. You can create or modify the file /var/www/html/stats/css/custom.css and add your override classes there.
The best way to find out what classes are being used or how to change them is to use the aforementioned Developer Console in your browser to inspect elements, and see the actual CSS class assigned to each elements, so you can add your own overrides in the custom.css file. For example, to change every report title to have a black background and white text color, you can add this to your custom.css file:
table caption h3 {
    background-color: #000;
    color: #fff;
}
Troubleshooting
Enable DEBUG
If something goes wrong after installation (like seeing a blank page when browsing http://your.server/stats), you can enable several debug levels by modifying Asternic’s main configuration file.
Asternic configuration file is located in /var/www/html/stats/config.php. Open it up with your favorite text editor and go to the end of it, you will see something similar to this:
define('DEBUG',       false );
define('SQLDEBUG',    false );
define('ACTIONDEBUG', false );
define('MAILDEBUG',   false );
You can set any of them to true to enable different levels of debug. For basic troubleshooting you might want to set DEBUG and SQLDEBUG to true. Save the file after the change, and then run a report from your browser or refresh the page.
To see the DEBUG output, you will need your browser javascript/developer console. You can use a shortcut that is now pretty much universal accross browsers. If that does not work, please refer to your browser help / menus.
How to open developer console in your browser
| Operating System | Keyboard Shortcut |
|---|---|
| Windows | Ctrl + Shift + J |
| Mac | Cmd + Shift + J |
If there is an error, you will most probably see it in red color. You will see multiple other debug messages in normal color. IF SQL debug is enabled, you will see actual SQL queries that are performed, and if there is an error with one, you will see it in red with the actual MySQL error that got returned. This will help with troubleshooting and getting your problem fixed in the case you need to open a ticket.
Uninstall
If you want to uninstall the software, follow the appropriate procedure (depending on your Asternic version). You can find out your Asternic version by pointing to the Asternic logo in the bottom right of the reports, after a couple of seconds a tooltip will appear showing the version number. You can also find out the version number by selecting Setup => License from the menu.
Asternic 2.3.0 or newer
In case you want to remove all related files and services, asuming you installed via the make install command, follow these steps:
Stop the service script:
service asterniclog stop
Since version 2.3.0, if you have the src files and Makefile in place (usually in /usr/src/asternic-stats-pro-2.3.x), you can change to that directory and run make install:
cd /usr/src/asternic-stats-pro-2.3.11
make uninstall
This process remove files, but it won’t drop the database, if you want to drop the database run: (warning, it will remove all your data, you won’t be able to recover it):
mysqladmin -u root -p drop qstats
Uninstalling older Asternic versions
For older version you will have to remove things by hand:
Remove /var/www/html/stats and /usr/local/parselog:
rm -rf /var/www/html/stats
rm -rf /usr/local/parselog
Remove the service script:
chkconfig --del asterniclog
rm /etc/rc.d/init.d/asterniclog
rm /etc/sysconfig/asterniclog
Remove the database:
mysqladmin -u root -p drop qstats
And that’s it.