Report Selection
When logged into Asternic you will have the option to chose a subset of your extensions to run a report. Also a date range and a time frame. There are some shortcuts to select a data range, like 'This Week', 'Last month', 'Yesterday', etc. You can also select a group instead of a set of extensions should you have groups configured for your extensions.
You will also see a call summary for the current date at the very top.
Once your selection is done you can run the report. If you have lots of data, it might take some time to bring you the first result, and you will be able to navigate to different reports by selecting their appropriate Tab in the web interface
Outgoing Tab
This section will show reports that includes only outgoing calls for the selected time period/etensions.
You will see three sections reports:
- summary: report summary, showing some totals
- grouped by user: group all calls per user
- grouped by group/accountcode: group all calls per configured group or account code (like 'Sales Department')
Reports are identical in its nature, only change factor is the grouping field.
Incoming Tab
Similar to the outgoing tab, you will see only incoming calls that ended up being answered by any of your users/extensions. You will see three sections:
- summary: report summary, showing some totals
- grouped by user: group all calls per user
- grouped by group/accountcode: group all calls per configured group or account code (like 'Sales Department')
Reports are identical in its nature, only change factor is the grouping field.
Combined Tab
These reports will combine and show both incoming and outgoing calls into the same report, always grouping results. Again you have 3 sections:
- summary: report summary, showing some totals
- grouped by user: group all calls per user
- grouped by group/accountcode: group all calls per configured group or account code (like 'Sales Department')
Detailed Tab
This report shows a call detail, with no grouping at all, showing all individual calls made for the selected extensions in the selected time range. The report can be sorted arbitrarily by cliking on the column headers, and can be searched using the Search facility. You can also export data to different formats.
Distribution Tab
Reports here will change grouping by time intervals rather than extensions or groups. So you can see calls made per day, week, month, etc. There are also distribution by user in form of a heat chart per day.
Trunks
There is a chart with trunk usage over the time period selected for the report.
Outgoing Reports Description
On the outgoing reports, you will see several fields, here is a description for each:
User
The name of the user/extension
Count
The total number of outgoing calls made but that user/group
Missed
Number of calls made by that user/group that failed (not answered)
% Missed
Percentage of missed calls considering the total call count for that user/group
Billable Time
Call duration that is considered billable (after answering, not counting ring time)
% Billable Time
Percentage of billable time considering the total billable time for all extensions/groups in the report
Average Duration
Average duration of calls for that user/group
Total Ring Time
Total ring time (waiting for the call to be answered).
Average Ring Time
Average ring time, considering the total ring time for that particular user/group.
Cost
Call cost after the call rates are applied (if there is rating set for it).
Incoming Reports Description
On the incoming reports, you will see several fields, here is a description for each:
User
The name of the user/extension
Count
The total number of incoming calls made but that user/group
Missed
Number of calls made by that user/group that failed (not answered)
% Missed
Percentage of missed calls considering the total call count for that user/group
Billable Time
Call duration that is considered billable (after answering, not counting ring time)
% Billable Time
Percentage of billable time considering the total billable time for all extensions/groups in the report
Average Duration
Average duration of calls for that user/group
Total Ring Time
Total ring time (waiting for the call to be answered).
Average Ring Time
Average ring time, considering the total ring time for that particular user/group.
Cost
Call cost after the call rates are applied (if there is rating set for it).
Combined Reports Description
Column description is similar to the other reports, but as there are mixed inbound and outbound calls, you will see those columns and you won't see the cost column as inbound calls are never rated:
User
The name of the user
Total
The total number of calls handled by the user/group, both inbound and outbound counted, no matter their disposition
Incoming
The total number of incoming calls handled by that user/group
Outgoing
The total number of outgoing calls handled by thhat user/group
Completed
The total number of calls handled successfuly by that user/group
Missed
Number of calls that have failed (not answered)
% Missed
Percentage of missed calls considering the total call count
Duration
Call duration, includes both ring time + billable time if applies.
% Duration
Percentage of call durations considering the total duration time for all extensions in the report
Average Duration
Average duration of calls for that user/group
Total Ring Time
Total ring time. time waiting for the call to be answered.
Average Ring Time
Average ring time, considering the total ring time
Detailed Report Description
Here is a list of fields available in this report:
Date
Date/time the call was initiated
Play
Icons to play/download recording if available
Extension
Extension/User that made the call
Direction
Call direction, either Incoming or Outgoing
From
Callerid of call originator
To
Callerid or dialed number of call receptor
Ring Time
Time spent before call being answered
Billable Time
Duration of call after being answered
Disposition
Call disposition, could be ANSWERD, BUSY, FAILED, etc.
Destination
Name of the destination if there is a rate configured for that call
Cost
Cost of the call if there is a rate configured for that destination number.
Distribution Reports Description
Distribution reports show all received and made calls, grouped by time intervals. But you will also find some heat charts of call usage per user.
Distribution by Time Interval
- month
- week
- day
- hour
- day of week
Here is a sample report you can find:
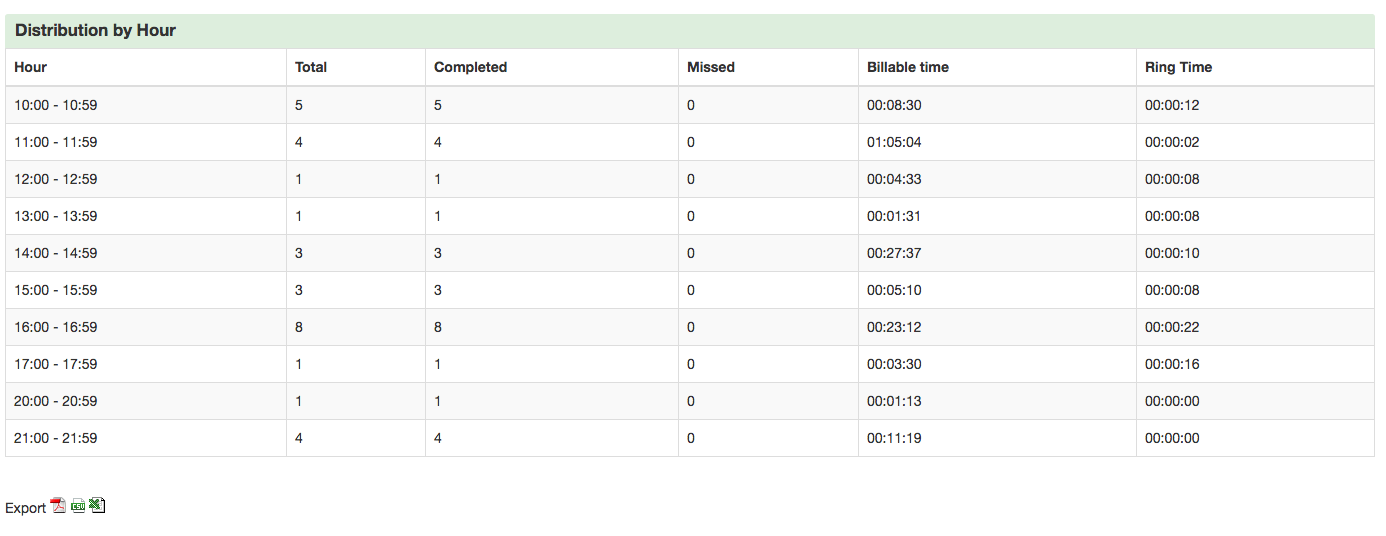
Fields for all distribution reports are the same, here is a break down:
Interval
This field varies depending on the gruouping, it could be Month, Week, Day, Hour or Day of Week
Total
Total number of calls processed from/to extensions on the current Interval
Completed
Total number of completed (answered) calls on the current Interval
Missed
Total number of missed (not answered) calls on the current Interval
Billable time
Total call duration since call was answered for that Interval
Ring Time
Total duration before the call was connected/answered.
Distribution per User
Here you will see a heat chart for each user, that will break down each day in 24 hours slots, and will show in each slot the number of calls or duration of calls made/received by that particular user.
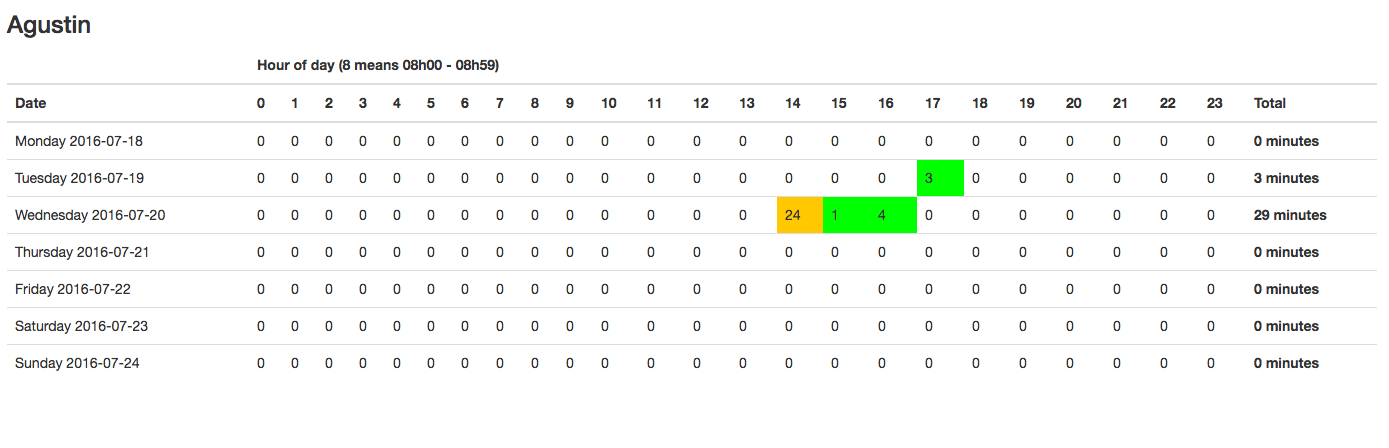
At the top of all those charts you have a selection box where you can change the value to be represented in minutes or number of calls.
Each cell will have a color representing the 'heat/activity' for that user. The closer the call duration for that hour slot reaches 60, the redish it will show. No activity in white. Gradient startes from green on 1 minute to full red in 60 minutes.